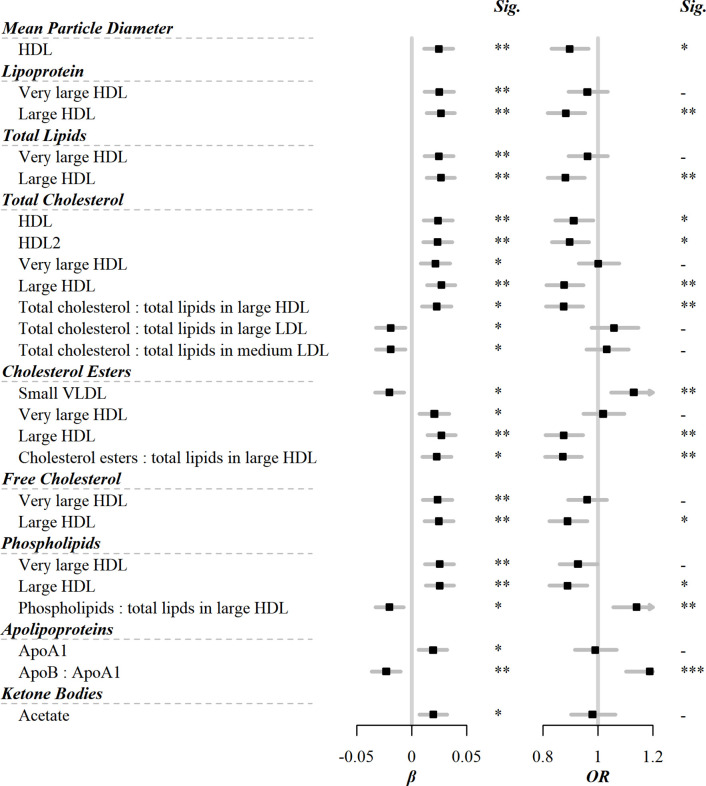
Figure 1. Significant associations of egg consumption and metabolic markers, and associations of these markers with risks of CVD.
Models were adjusted for age, sex, region, education, household income, occupation, marital status, tea-drinking habit, smoking status, alcohol intake, physical activity, self-rated health, fasting time, and frequency of other 11 food groups. Black squares represented coefficients or ORs, while gray horizontal lines represented 95% CI. Significance (Sig.): *p<0.05, **p<0.01, ***p<0.001 (FDR-adjusted p using the Benjamini-Hochberg method). The source data can be found in .

