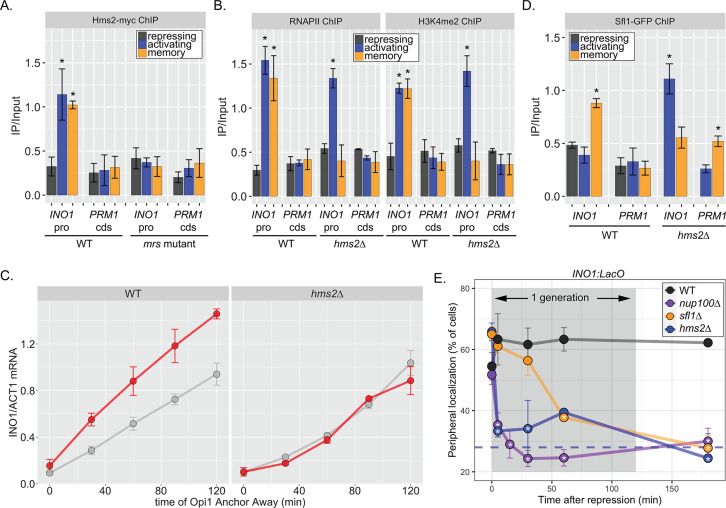
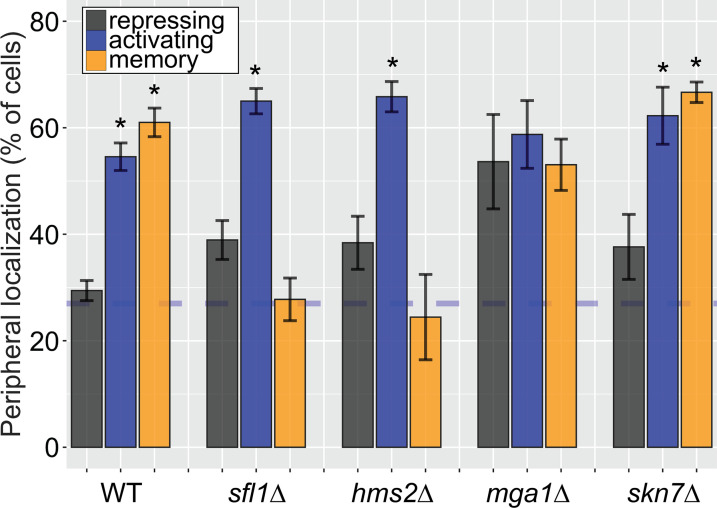
Figure 3. Two different Hsf1-like TFs are required for inositol memory.
(A–C) Chromatin immunoprecipitation (ChIP) against Hms2-myc (A), RNAPII (B, left), H3K4me2 (B, right), or Sfl1-GFP (D) in the indicated strains grown under activating, repressing, or memory (3 hr) conditions. Recovery of either the INO1 promoter or the repressed PRM1 coding sequence was quantified by real time quantitative PCR (RT-qPCR) and the average of ≥3 replicates ± SEM is plotted (*p-value<0.05 from one-tailed t-test compared with the repressing condition, alternative = greater). (C) Activation and reactivation of INO1 in wild type (WT) (left) and hms2∆ (right) strains upon removal of Opi1 by Anchor Away. Cells were harvested at indicated time points and INO1 mRNA was quantified relative to ACT1 mRNA by RT-qPCR (*p-value<0.05 from one-tailed t-test comparing reactivation and activation, alternative = greater). Data from the WT strain is the same as Figure 1D and is shown for comparison. (E) Peripheral localization of INO1 in either WT, sfl1∆, hms2∆, or nup100∆ strains. At t=0, inositol was added to cells growing without inositol and peripheral localization was scored at the indicated times. The doubling time of this strain (~120 min) is indicated. The average of three biological replicates ± SEM is plotted and each biological replicate ≥30 cells. Blue hatched line: expected peripheral localization for a randomly localized gene. *p-value<0.05 from one-tailed t-test compared with time = 0, alternative = less.


