
FIGURE.
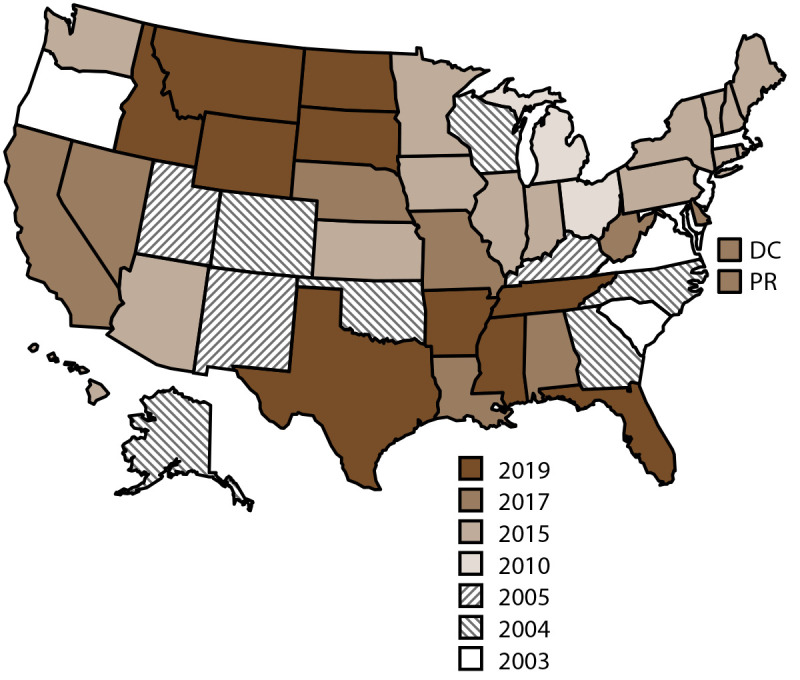
States participating in the National Violent Death Reporting System, by year of initial data collection* — United States and Puerto Rico, 2003–2019
Abbreviations: DC = District of Columbia; NVDRS = National Violent Death Reporting System; PR = Puerto Rico.
* Map of United States indicates the year in which the state or territory began collecting data in NVDRS. California began collecting data for a subset of violent deaths in 2005 but ended data collection in 2009. In 2017, California collected data from death certificates for all NVDRS cases in the state; data for violent deaths that occurred in four counties (Los Angeles, Sacramento, Shasta, and Siskiyou) also include information from coroner or medical examiner reports and law enforcement reports. In 2018, California collected data from death certificates for all violent deaths in the state in 2018 (n = 6,641); data for violent deaths that occurred in 21 counties (Amador, Butte, Fresno, Humboldt, Imperial, Kern, Kings, Lake, Los Angeles, Marin, Mono, Placer, Sacramento, San Benito, San Mateo, San Diego, San Francisco, Shasta, Siskiyou, Ventura, and Yolo) also included information from coroner or medical examiner reports and law enforcement (n = 3,658; 55.1%). In 2019, California collected data from death certificates for all violent deaths in the state in 2019 (n = 6,586); data for violent deaths that occurred in 30 counties (Amador, Butte, Colusa, Fresno, Glenn, Humboldt, Imperial, Kern, Kings, Lassen, Lake, Los Angeles, Marin, Modoc, Mono, Orange, Placer, Sacramento, San Benito, San Francisco, San Mateo, Santa Cruz, Shasta, Siskiyou, Solano, Sonoma, Tehama, Trinity, Ventura, and Yolo) also included information from coroner or medical examiner reports and law enforcement (n = 3,645; 55.3%). Michigan collected data for a subset of violent deaths during 2010–2013 and collected statewide data beginning in 2014. In 2016, Illinois, Pennsylvania, and Washington began collecting data on violent deaths in a subset of counties that represented at least 80% of all violent deaths in their state or in counties where at least 1,800 violent deaths occurred. Illinois’s 2018 data are for violent deaths that occurred in 28 counties (Adams, Boone, Champaign, Cook, DuPage, Effingham, Fulton, Kane, Kankakee, Kendall, Lake, Lasalle, Livingston, Logan, Macoupin, McDonough, McHenry, McLean, Madison, Peoria, Perry, Rock Island, St. Clair, Sangamon, Tazewell, Vermillion, Will, and Winnebago). Pennsylvania’s 2018 data are for deaths that occurred in 39 counties (Adams, Allegheny, Armstrong, Beaver, Berks, Blair, Bradford, Bucks, Cambria, Carbon, Centre, Chester, Clarion, Clearfield, Clinton, Columbia, Crawford, Dauphin, Delaware, Fayette, Forest, Greene, Indiana, Jefferson, Lackawanna, Lancaster, Lehigh, Luzerne, Monroe, Montgomery, Montour, Northampton, Philadelphia, Schuylkill, Union, Wayne, Westmoreland, Wyoming, and York). Illinois’s 2019 data are for violent deaths that occurred in 47 counties (Adams, Alexander, Bond, Boone, Brown, Bureau, Champaign, Clay, Cook, DeKalb, Douglas, DuPage, Effingham, Fayette, Fulton, Grundy, Henry, Iroquois, Jackson, Jefferson, Kane, Kankakee, Kendall, Lake, Lasalle, Livingston, Logan, Macoupin, McDonough, McHenry, McLean, Madison, Menard, Peoria, Perry, Piatt, Putnam, Rock Island, St. Clair, Sangamon, Schuyler, Stark, Tazewell, Vermilion, Wayne, Will, and Winn). Pennsylvania’s 2019 data are for violent deaths that occurred in 40 counties (Adams, Allegheny, Armstrong, Berks, Blair, Bradford, Bucks, Cameron, Cambria, Carbon, Centre, Chester, Clarion, Clearfield, Clinton, Crawford, Dauphin, Delaware, Erie, Fayette, Forest, Greene, Indiana, Jefferson, Lackawanna, Lancaster, Lehigh, Luzerne, Monroe, Montgomery, Northampton, Philadelphia, Schuylkill, Somerset, Sullivan, Susquehanna, Union, Westmoreland, Wyoming, and York). In 2018, Washington began collecting statewide data for all deaths that occurred in the state in 2018. Beginning in 2019, all 50 U.S. states, DC, and Puerto Rico were participating in the system.