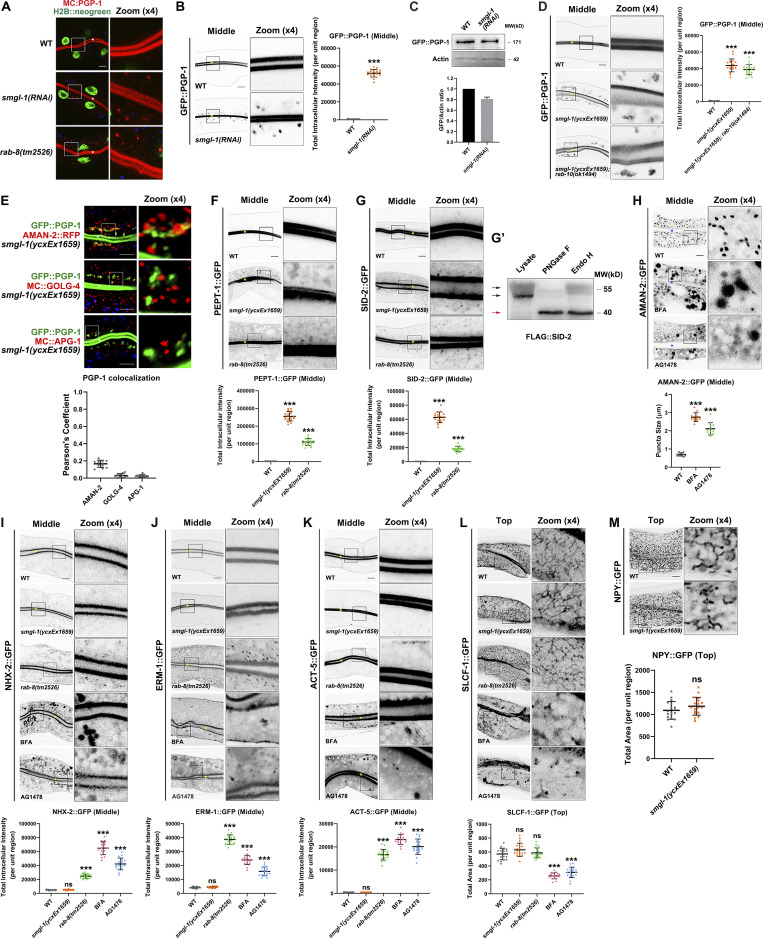
Figure S1.
Loss of RAB-8 leads to the aberrant distribution of all apical but not basolateral proteins, and BFA or AG1478 treatment impairs the intracellular distribution of AMAN-2, NHX-2, ERM-1, ACT-5, and SLCF-1. (A) Confocal images showing the intracellular localization pattern of PGP-1 in smgl-1 and rab-8 deficient animals, using H2B::neogreen as a nuclear marker. (B) GFP::PGP-1 accumulated in intracellular structures in SMGL-1 knockdown animals. (C) Expressional levels of GFP::PGP-1 in wild-type and SMGL-1 knockdown animals. (D) The distributional defects of PGP-1 in smgl-1 mutants were not exacerbated by simultaneous loss of RAB-10. (E) GFP::PGP-1-labeled puncta were separable from Golgi markers AMAN-2::RFP (cis- and medial-Golgi cisternae), mCherry::GOLG-4 (TGN), and mCherry::APG-1 (TGN) in smgl-1(ycxEx1659) mutants. Pearson’s correlation coefficients for GFP and mCherry signals were calculated (n = 12 animals). The signals from the apical membrane were avoided by manual ROI selection. (F and G) PEPT-1::GFP and SID-2::GFP accumulated in intracellular structures in smgl-1(ycxEx1659) and rab-8(tm2526) mutants. (G′) FLAG::SID-2 transgenic animals were analyzed by immunoblotting using anti-FLAG antibody after Endo H or PNGase F treatment. (H) BFA and AG1478 treatment disrupted the intracellular localization of AMAN-2::GFP. (I–K) The localization of NHX-2::GFP, ERM-1::GFP, and ACT-5::GFP remained unchanged in smgl-1(ycxEx1659) but accumulated on intracellular structures and/or basolateral membrane in rab-8(tm2526) mutants. BFA and AG1478 treatment caused the intracellular accumulation of NHX-2::GFP, ERM-1::GFP, and ACT-5::GFP. (L) The basolateral membrane protein SLCF-1::GFP exhibited similar tubular localization in wild-type, smgl-1(ycxEx1659), and rab-8(tm2526) mutants. BFA and AG1478 treatment disrupted SLCF-1::GFP-labeled basolateral tubular structures. (M) The basolateral membrane protein NPY::GFP exhibited similar tubular localization in wild-type, smgl-1(ycxEx1659), and rab-8(tm2526) mutants. The signals from the apical membrane were avoided by manual ROI selection. Data are shown as mean ± SD (n = 18 each, six animals of each genotype sampled in three different unit regions of each intestine defined by a 100 × 100 [pixel2] box positioned at random). Statistical significance was determined using a two-tailed, unpaired Student’s t test. For multiple comparisons, statistical significance was determined using a one-way ANOVA followed by a post-hoc test (Dunn’s Multiple Comparison Test). ***, P < 0.001. Data distribution was assumed to be normal, but this was not formally tested. Scale bars: 10 μm. Colored asterisks indicate intestinal lumen. A dotted line indicates the outline of the intestine. Source data are available for this figure: SourceData FS1.

