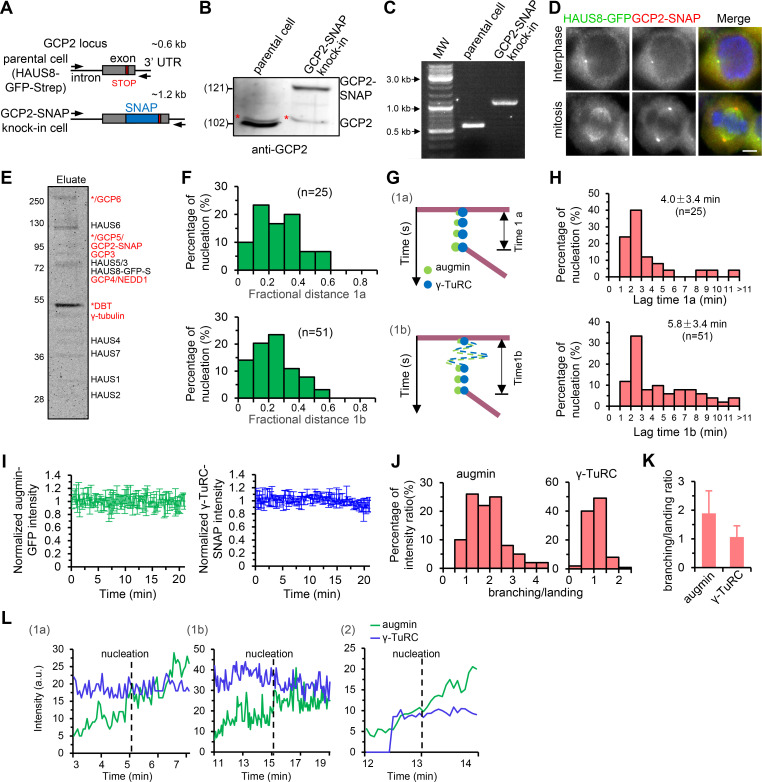
Figure S2.
Characterization of HAUS8-GFP-Strep/GCP2-SNAP double knock-in HeLa cell lines. (A–C) Characterization of GCP2-SNAP knock-in based on the parental HAUS8-GFP-Strep knock-in HeLa cell line. (A) Schematic illustration of primer sets and the expected PCR products. Western blotting analysis (B) and PCR genotyping (C) showing that the GCP2-SNAP knock-in is homozygous. The red asterisk indicates a nonspecific band detected by the GCP2 antibody. (D) Immunofluorescence staining for SNAP and DNA (DAPI) in HAUS8-GFP-Strep/GCP2-SNAP double knock-in HeLa cell line. (E) Coomassie blue-stained gel with native augmin–γ-TuRC complex purified from nocodazole-arrested mitotic HAUS8-GFP-Strep/GCP2-SNAP double knock-in HeLa cells using one-step affinity purification with StrepTactin beads. Asterisks indicate putative contaminants. Above the band of γ-tubulin, a strong band marked with an asterisk represents dihydrolipoamide branched chain transacylase (DBT), as determined by mass spectrometry. (F) Distribution of fractional distance for class 1a and class 1b events. For 1a, n = 25; for 1b, n = 51. (G and H) Schematic representation (G) and histograms of distribution (H) of the lag time between the landing of augmin–γ-TuRC to the mother MT and nucleation of the daughter MT for class 1a and class 1b events. For 1a, n = 25; for 1b, n = 51. (I) Plots of intensities of single augmin-GFP (green) or γ-TuRC-SNAP/AF647 (blue) puncta attached on the surface of the coverslip rather than along the MT during the 20-min imaging window. n = 10 puncta from three experiments. (J) Histogram shows distribution of the ratio of augmin or γ-TuRC intensity at the time point of branching nucleation to that at the time point of the augmin–γ-TuRC complex landing (branching/landing). n = 100 events from 10 experiments. (K) Quantification of the average branching/landing ratio derived from J. n = 100 events from 10 experiments. (L) Plots of augmin intensity (green) and γ-TuRC intensity (blue) of the branching nucleation-competent puncta as indicated by red arrows in Fig. 2, F–H, against time. Scale bars, 2 μm. Data represent mean ± SD.

