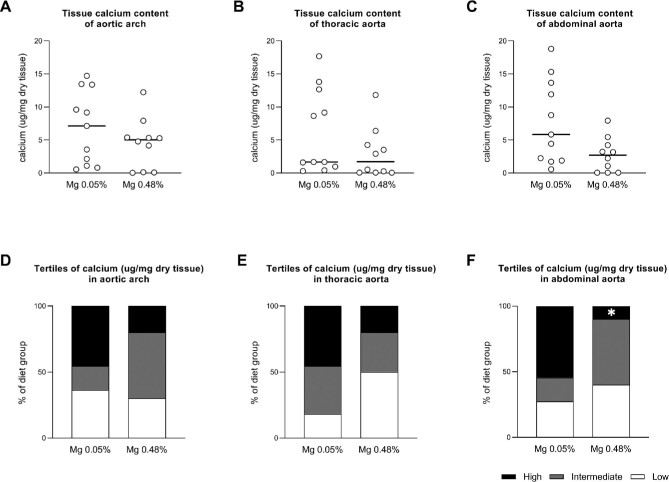
FIGURE 2:
Calcium content in aortic segments of partially nephrectomized rats fed either a high or normal magnesium diet. (A–C) Calcium content in μg/mg dry tissue in the (A) aortic arch and (B) thoracic and (C) abdominal aorta. Dots represent individual animals. Horizontal lines represent medians. (D–F) The percentage of animals in each diet group, with a calcium content within the highest (black bars), intermediate (grey bars) and lowest tertile (white bars), respectively. Mg 0.05%: magnesium 0.05% w/w diet; Mg 0.48%: magnesium 0.48% w/w diet. *P < .05 for high versus normal dietary magnesium.

