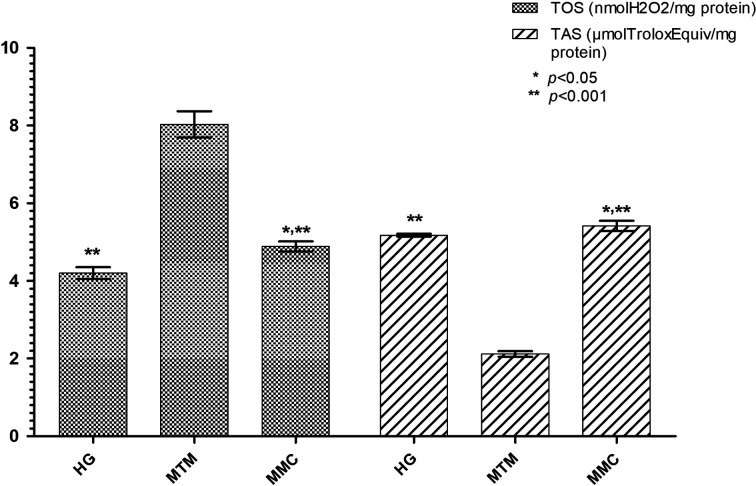
Fig. 2.
The effects of carvacrol on TOS and TAS levels in the liver tissues of rats administered methanol. Bars are the mean±standard deviation (SD). The methanol group (MTM) was compared with the HG and MMC groups. (*: P<0.05, the methotrexate+methanol+carvacrol group (MMC) was compared with the HG). TOS: total oxidant status; TAS: total antioxidant status; HG: healthy group; MTM: methotrexate+methanol group; MMC: methotrexate+methanol+carvacrol group.

