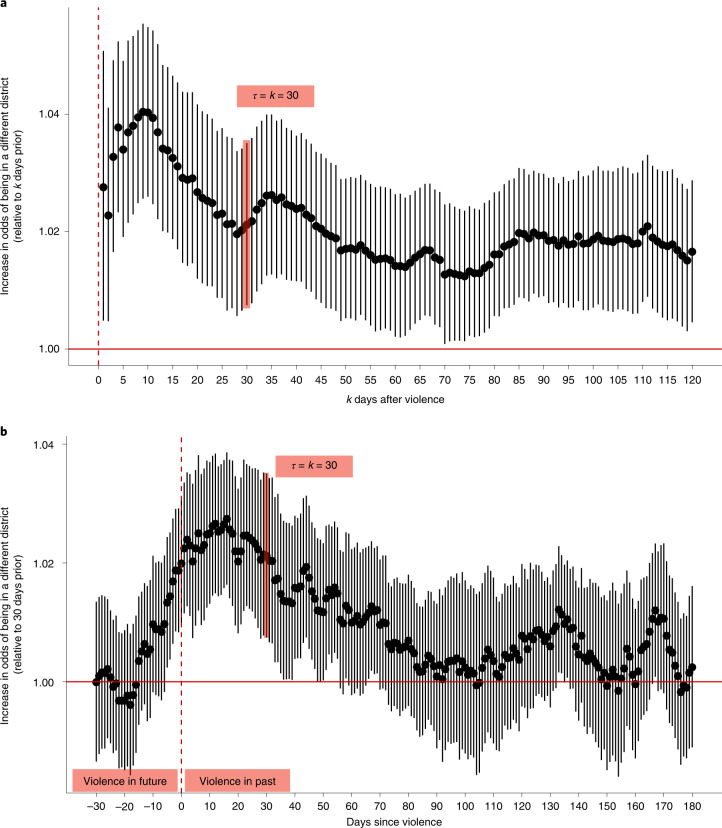
Fig. 2. The effect of violence on internal displacement.
a, Displacement for those present on the day of the violent event. Exponentiated regression coefficients, plotted on the y axis, indicate the increase in the odds that individuals who were in the district on the day of violence are in a different district k days later. The bars indicate 95% CIs. The estimates are based on 3,354 violent events. τ indicates the number of lags for treatment variables in the regression model (Methods), representing the number of days since violence. The full results are provided in Supplementary Table 2. b, Thirty-day displacement. Exponentiated regression coefficients indicate the increase in the odds that individuals are in a different district than they were 30 days prior. Negative x-axis values correspond to days preceding violence. The bars indicate 95% CIs. The estimates are based on 3,354 violent events. τ represents days since violence. The full results are provided in Supplementary Table 3.

