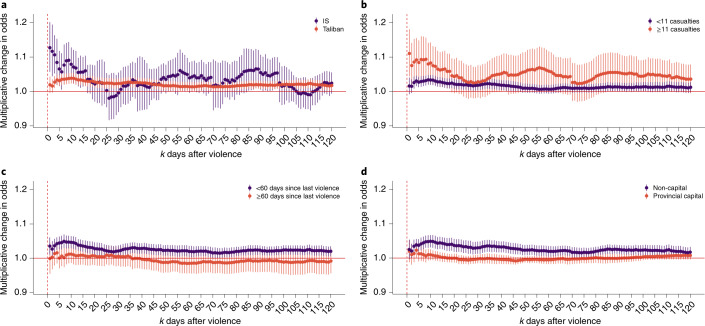
Fig. 3. The effect of violence on displacement, disaggregated by type and location.
a–d, The impact of a violent day on individuals who were in the district on the violent day. The coefficients are estimated separately for each panel. Panel a shows displacement for IS (N = 185) versus Taliban violence (N = 3,134); the full results are provided in Supplementary Table 4. Panel b shows displacement for events with 11 or more casualties (N = 397) versus 10 or fewer casualties (N = 2,957); the full results are provided in Supplementary Table 5. Panel c shows displacement for events following fewer than 60 days of peace (N = 2,319) versus 60 or more days (N = 1,035); the full results are provided in Supplementary Table 6. Panel d shows displacement for events in provincial capitals (N = 2,460) versus non-capitals (N = 894); the full results are provided in Supplementary Table 7.

