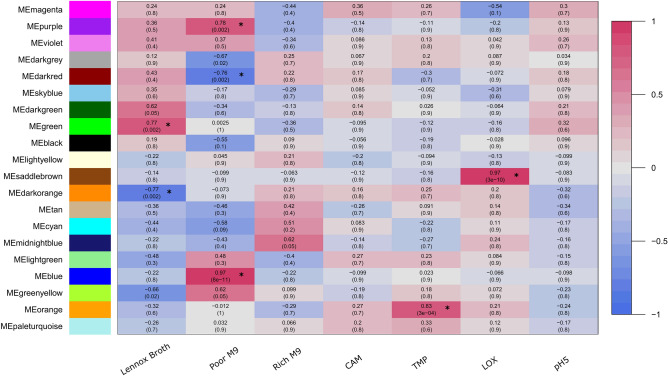
Figure 3.
Module-trait relationships. Associations between module eigengenes (ME) and experimental conditions. Rows represent MEs and columns represent growth environments. Numbers outside and within parentheses are correlation coefficients and FDR corrected p-values of the correlations, respectively. Positive correlations are indicated by pink colour and negative correlations by blue colour. Significant associations are highlighted with an asterisk sign (*).

