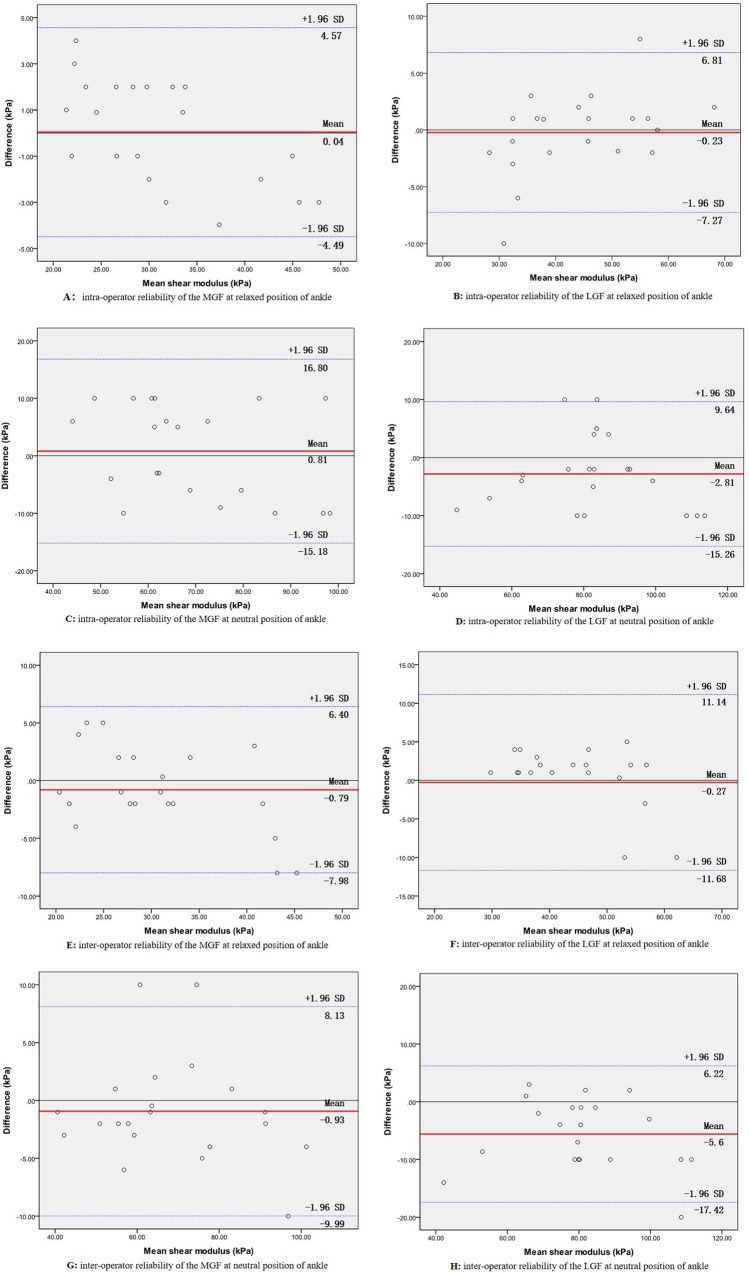
Figure 2.
Bland–Altman plots of intra- and inter-operator reliability of the shear moduli of the MGF and LGF. The differences in the shear moduli between day 1 and day 5 are plotted against the mean of each participant for the MGF (A: relaxed position; C: neutral position) and LGF (B: relaxed position; D: neutral position). The differences in the shear moduli between operator (A) and operator (B) are plotted against the mean shear moduli of each participant for the MGF (E: relaxed position; G: neutral position) and LGF (F: relaxed position; H: neutral position). In each image, the continuous line is the mean difference, and the dotted lines represent two SDs above and below the mean difference.

