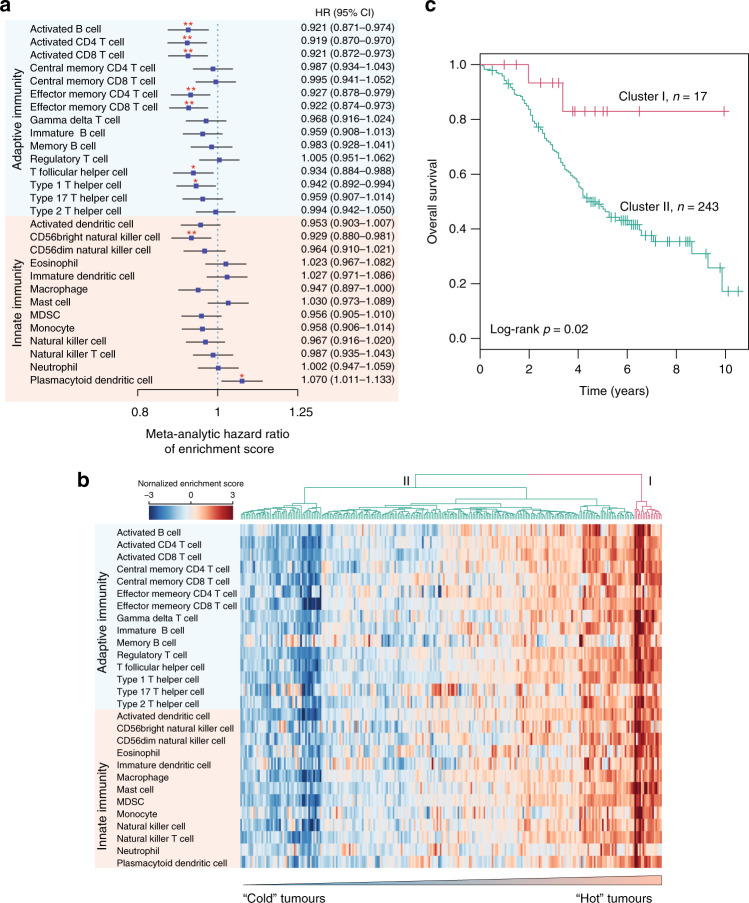
Fig. 2. The landscape of the tumour immune microenvironment.
a Forest plot visualising the meta-analytic hazard ratios (95% confidence interval) of univariate Cox regression analyses of each infiltrating immune subpopulation in the 16 cohorts. b Hierarchical clustering of intratumoural immune states based on the cellular composition of the immune infiltrates calculated using ssGSEA. The two predominant clusters are referred to as ‘Cluster I’ and ‘Cluster II’. c Kaplan–Meier survival curves of overall survival between Cluster I and Cluster II. Statistical analysis was performed using a log-rank test. *P < 0.05, **P < 0.01. ssGSEA single sample gene set enrichment analysis.

