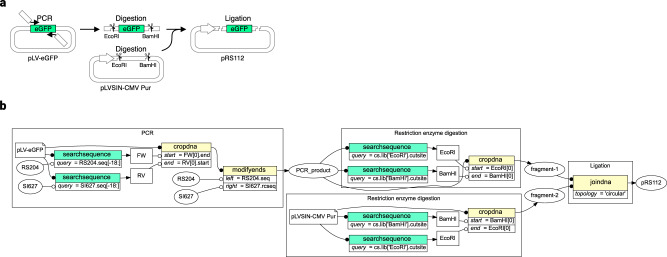
Fig. 3. Simple molecular cloning.
a Conceptual diagram representing the cloning of eGFP into a lentiviral plasmid backbone. b QUEEN operational flow representing the same DNA cloning process. The visualization was directly generated from the output gbk file using QUEEN. The file shape, round, and uncolored rectangular objects represent the input gbk files, dsDNA objects, and feature objects, respectively. Colored boxes represent QUEEN operational functions with the colors corresponding to Fig. 2. Open and closed circle-headed lines represent information flows as QUEEN objects and input parameters, respectively.

