
Fig. 2. Relationship between per-birth twinning probability and maternal total births.
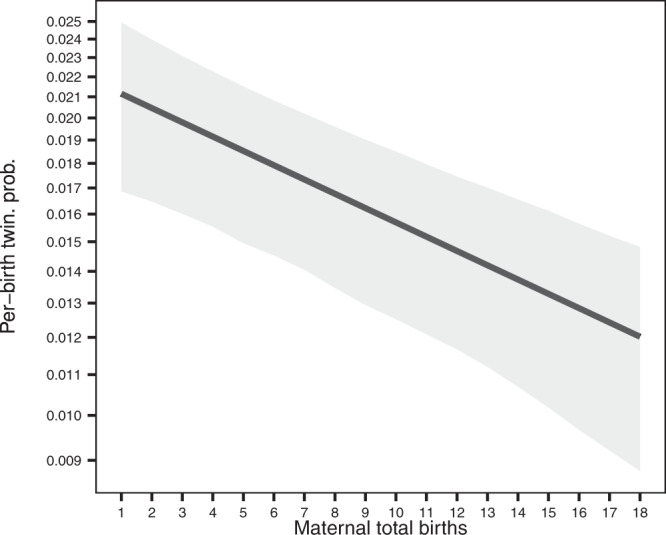
This plot shows marginal predictions (line) ± CI95% (grey area) from the fit of a generalised linear mixed-effects model including maternal total births as fixed effect and variation between populations as a random effect (n = 21,290 mothers in total, from 8 populations; see Table 1). Estimates obtained for per-birth twinning probability vary between 0.021 (CI95%: 0.017, 0.025) for mothers who gave birth only once, and 0.012 (CI95%: 0.0088, 0.015) for mothers who gave birth 18 times—the maximal total births recorded in our data. Note that the y-axis is represented on a logit scale so as to display the outcome of the logistic (binomial) regression as a straight line with an estimated slope β of −0.0338 (CI95%: −0.0510, −0.0168). Model summary statistics are provided in Supplementary Table 3.