
Fig. 5. Goodness-of-fit for the 16 simulation scenarios testing which of the four mechanisms could account for the slope between the logit of the per-birth twinning probability and maternal total births shown in Fig. 2.
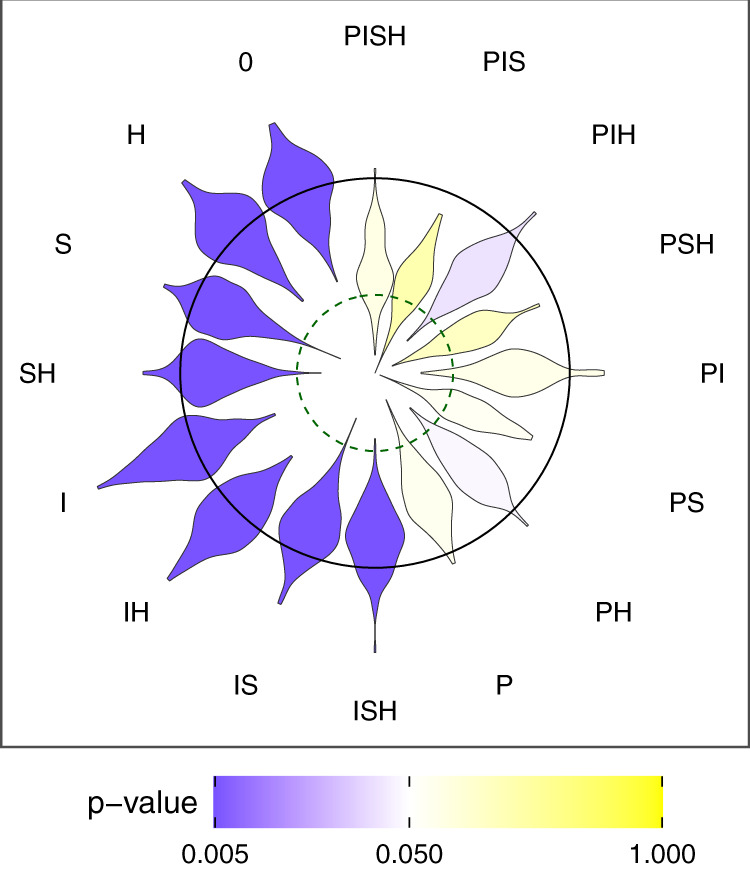
The letters P, I, S & H are used to indicate which mechanisms were included in each simulation scenario. Mechanism P considers that a twinning event impacted parity progression. Mechanism I considers that a twinning event impacts the interval between that birth and the next one. Mechanism S considers that the reproductive schedule of a mother impacts both her twinning probability and her total number of births, creating an association between these two variables. Mechanism H considers that twinning propensity and intrinsic fertility are associated as a consequence of maternal heterogeneity. The scenario 0 does not include any of these mechanisms. The shape of each petal of the flower plot shows the distribution of slopes obtained for simulation replicates under each scenario (n = 200 per scenario). The colour of each petal provides the result of a goodness-of-fit test. Yellow petals correspond to simulation scenarios compatible with the observed slope (p-value > 0.05) and purple petals correspond to scenarios incompatible with them (p-value ≤ 0.05), with variation in the intensity of the colour reflecting the p-value as shown in the colour bar. The dashed green inner circular contour line represents the slope shown in Fig. 2. A simulation scenario that would consider the true mechanisms would therefore show a yellow petal whose centre was intersected by this circle. The black outer circular contour line corresponds to a null slope with negative slopes falling within the circle and positive slopes being outside.