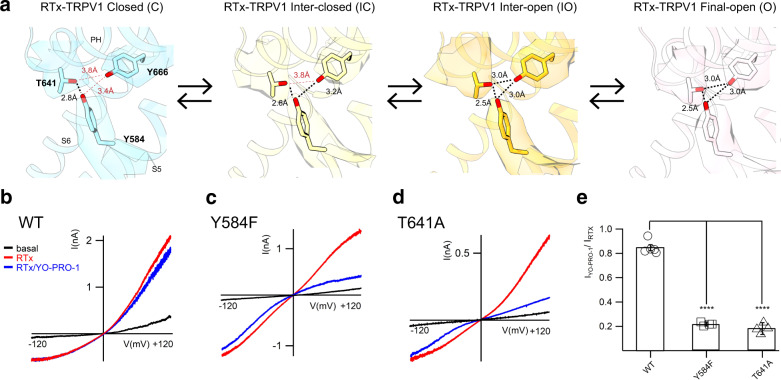
Fig. 6. PH-S5-S6 triad hydrogen bond network in TRPV1 for RTx gating.
a The cryo-EM maps (surface) and respective models (sticks) depicting the tripartite hydrogen bond network of PH-S5-S6 in TRPV1C, RTx (skyblue), thresholding 0.15, TRPV1IC, RTx (yellow), thresholding 0.045, TRPV1IO, RTx (gold), thresholding 0.1, and TRPV1O, RTx (pink), thresholding 0.04. The black dotted-lines indicate hydrogen bonds. The red dotted-lines indicate distance measurements between atoms where hydrogen bonds are broken. b–e TRPV1 Y584F and T641A reduce large cation permeabilty (YO-PRO-1, M.W. 376 Da) in the presence of RTx. Representative inside-out current traces of TRPV1 WT b, TRPV1 Y584F c, and TRPV1 T641A d. Current traces for basal, RTx (200 nM) activation (red trace) and intracellular application of 10 μM YO-PRO-1 (blue trace). e Summary of current inhibition by YO-PRO-1 (10 µM) of TRPV1 WT, TRPV1 Y584F and TRPV1 T641A after application of a saturating concentration of RTx (200 nM). Data are presented as mean ± s.e.m.; P < 0.0001 for T641A and Y584F, two-tailed unpaired Student’s t test. (For WT, n = 5, for Y584F and T641A, n = 4). Source data are provided as a Source Data file.

