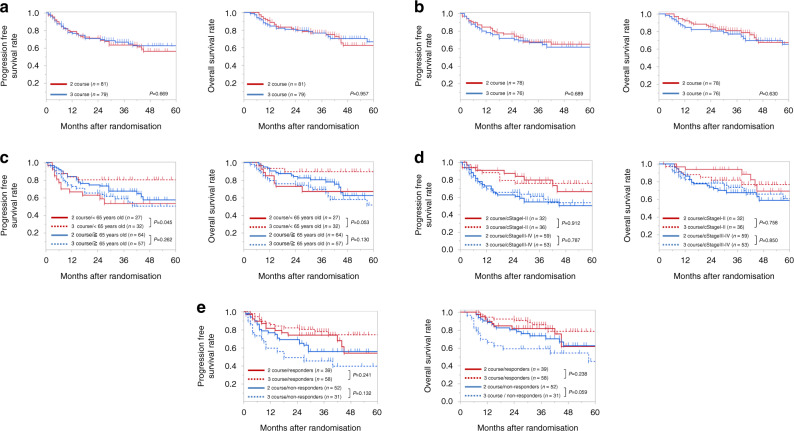
Fig. 2. Kaplan–Meier survival curves show progression-free and overall survival.
(Left) Progression-free survival and (right) overall survival results are shown from (a) an intention-to-treat analysis and (b) a per protocol analysis of the two-course (red lines) and three-course (blue lines) treatment groups. c–e Kaplan–Meier survival curves show (left) progression-free and (right) overall survival in groups stratified according to the two-course (solid lines) and three-course (dotted lines) treatment groups and by the (c) age group (<65 y = red; ≥65 y = blue, (d) cStage (Stages I–II = red; Stages III–IV = blue), and (e) overall clinical response to neoadjuvant chemotherapy (responders = red; non-responders = blue).

