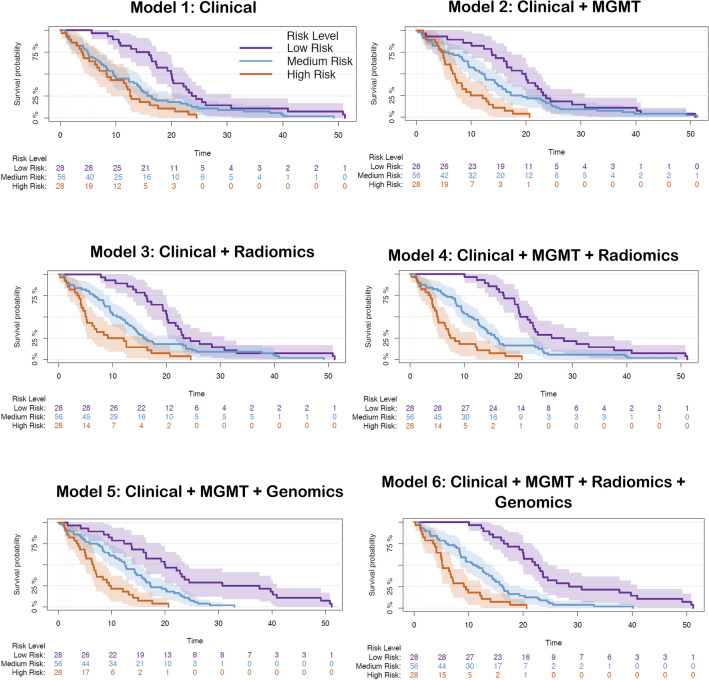
Figure 5.
Risk stratification based on overall survival for the patients in our cohort (n = 112) using the six Cox-PH models including different layers of information. For illustration purposes, we have displayed low, medium, and high levels of survival probability. The survival curves are illustrated with their 95% confidence intervals. Log-rank test was performed to test for differences between the survival functions of the low, medium, and high risk groups predicted by the Cox model. The p-values obtained using this test for Model 1 (Clinical): p = 0.00016; Model 2 (Clinical + MGMT): p = 1e−5; Model 3 (Clinical + Radiomics): p < 1e−5; Model 4 (Clinical + MGMT + Radiomics): p < 1e−5; Model 5 (Clinical + MGMT + Genomics): p < 1e−5; Model 6 (Clinical + MGMT + Genomics + Radiomics): p < 1e−5.

