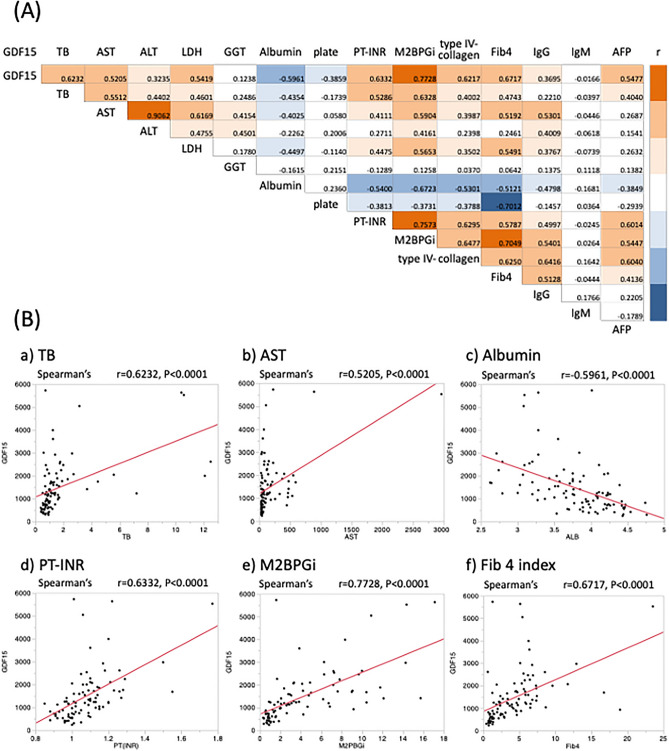
Figure 2.
(A) Correlation map between the clinical data in patients with liver disease by Spearman’s correlation analysis. The positive correlation between the data is shown in orange, while the negative correlation between the data is shown in blue. (B) Correlation of serum GDF15 levels and clinical data in patients with liver disease by Spearman’s correlation analysis. Serum GDF15 levels had significant positive correlations with TB, AST, PT-INR, M2BPGi, and Fib4 index. However, serum GDF15 levels were negatively correlated with albumin levels. GDF15, growth differentiation factor 15; TB, total bilirubin; AST, aspartate aminotransferase; ALT, alanine aminotransferase; PT-INR, prothrombin time-international normalized ratio; M2BPGi, Mac-2 binding protein glycosylation isomer; Ig, immunoglobulin; AFP, alpha-fetoprotein.

