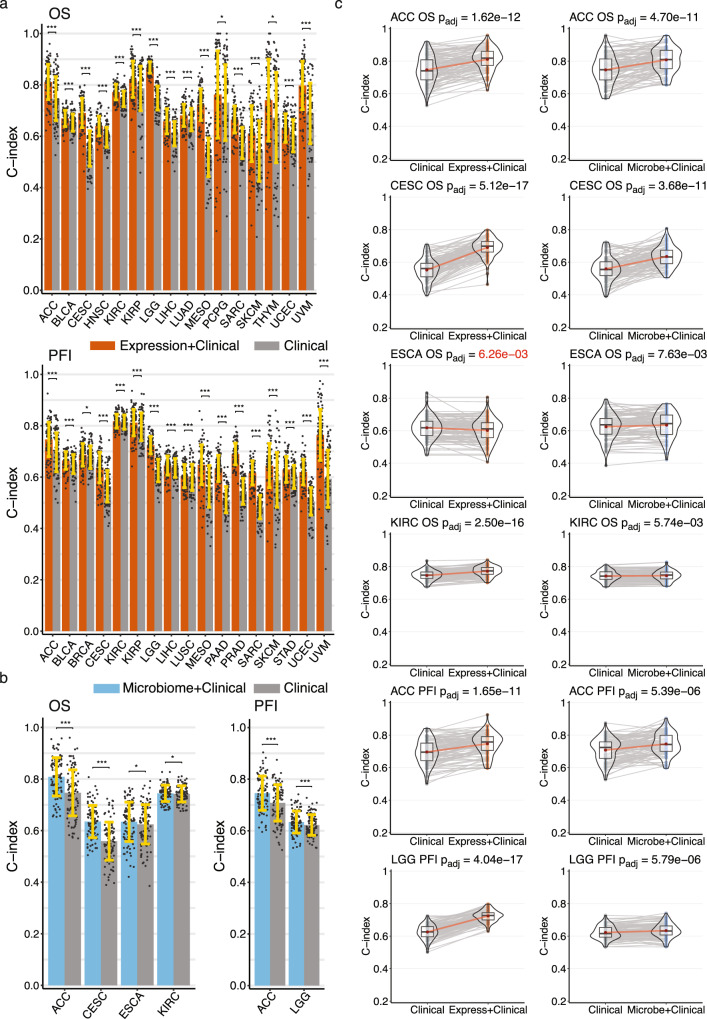
Fig. 2. Performance of gene expression and microbial abundance prognosis prediction models where features add predictive power to clinical covariates (a) gene expression with clinical covariate models (orange) and (b) microbial abundance with clinical covariate models (blue) vs clinical covariate-only models (grey).
In both a and b data are presented as mean values +/− standard deviation of the mean (SDM) for random training/test splits as described in Methods. Significance was computed by a paired two-sided Wilcoxon signed rank test, FDR adjusted for multiple comparisons: * , ** , ***. (c) C-index score violin density plots for training/test splits for the six models where microbial abundance with clinical covariate features outperform clinical covariate-only models. Box plots within the violin plots show median as center, the lower and upper hinges that correspond to the 25th and the 75th percentile, and whiskers that extend to the smallest and largest value no more than 1.5 times the interquartile range from the median. Corresponding gene expression models shown for comparison. Lines connecting points (light grey) represent score pairs from same train-test split on the data. Mean C-index scores shown as red dots with red lines connecting the means. Significance for the prediction improvement over clinical covariate-only models was calculated using a two-sided Wilcoxon signed-rank test and adjusted for multiple testing using the Benjamini-Hochberg method with adjusted p-values shown at top. These are the same p-values indicated in panel a. Adjusted p-values colored in red signify difference where clinical covariate-only model is better. Source data and exact p values are provided as a Source Data file. The number of cases involved in each experiment are shown in Supplementary Table 1.

