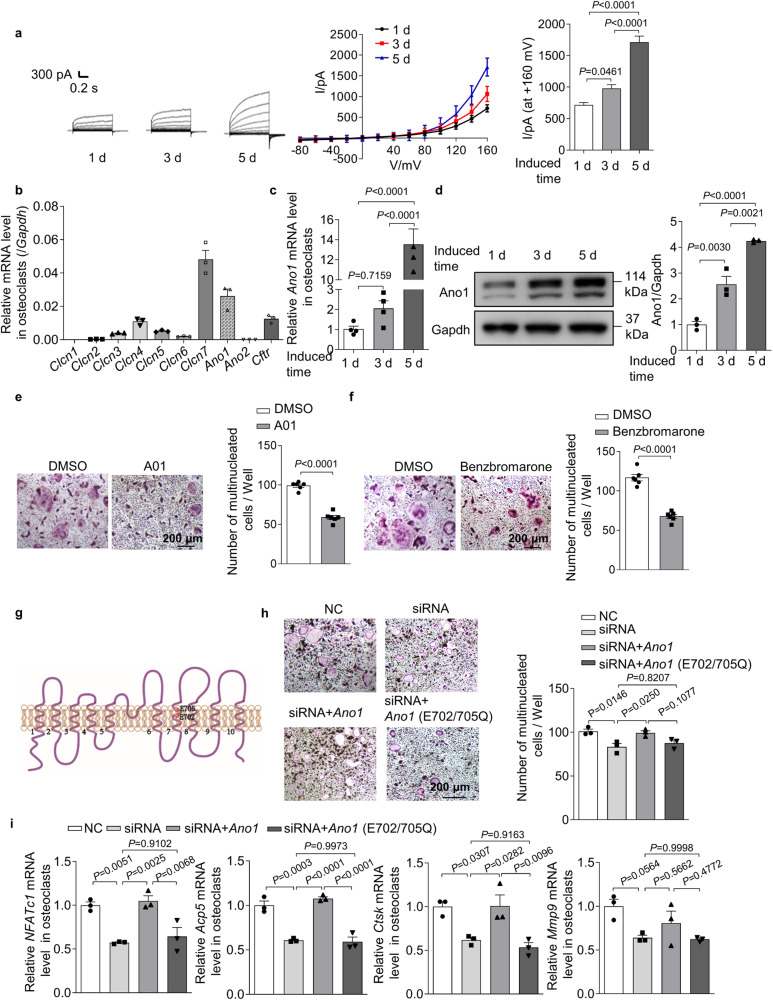
Fig. 1. The expression and function of Ano1 in osteoclast.
a Representative chloride currents recorded from voltage ramps from −80 to +160 mV in whole-cell patch-clamp during osteoclast differentiation. b QRT-PCR analysis of Clcn1, Clcn2, Clcn3, Clcn4, Clcn5, Clcn6, Clcn7, Ano1, Ano2, and Cftr mRNA levels after bone marrow monocytes (BMMs) were induced by RANKL for 5 days. c, d QRT-PCR analysis of Ano1 mRNA level (c) and western blot analysis of Ano1 protein level (d) during osteoclast differentiation. e Representative images of TRAP staining in osteoclasts after treatment with 20 μM CaCCinh-A01 (A01) or its control (DMSO) for 5 days (left). Scale bar, 200 μm. Quantification of the number of multinucleated cells per well (right) (n = 6). f Representative images of TRAP staining in osteoclasts after treatment with 10 μM Benzbromarone or its control (DMSO) for 5 days (left). Scale bar, 200 μm. Quantification of the number of multinucleated cells per well (right) (n = 6). g Schematic representation of the topology of Ano1 mutant (E702/705Q). h Representative images of TRAP staining in osteoclasts knockdown with Ano1 siRNA, rescued with Ano1 or its mutant Ano1 (E702/705Q) (left). Scale bar, 200 μm. Quantification of the number of multinucleated cells per well (right). i QRT-PCR analysis of NFATc1, Acp5, Ctsk, and Mmp9 mRNA levels in osteoclasts knockdown with Ano1 siRNA, rescued with Ano1 or its mutant Ano1 (E702/705Q). All data are the mean ± s.e.m. from three independent experiments. Two-tailed unpaired Student’s t-test was used for statistical evaluations of two group comparisons. Statistical analysis with more than two groups was performed with one-way analysis of variance (ANOVA) with Tukey’s multiple comparisons test to determine group differences. Source data are provided as a Source Data file.

