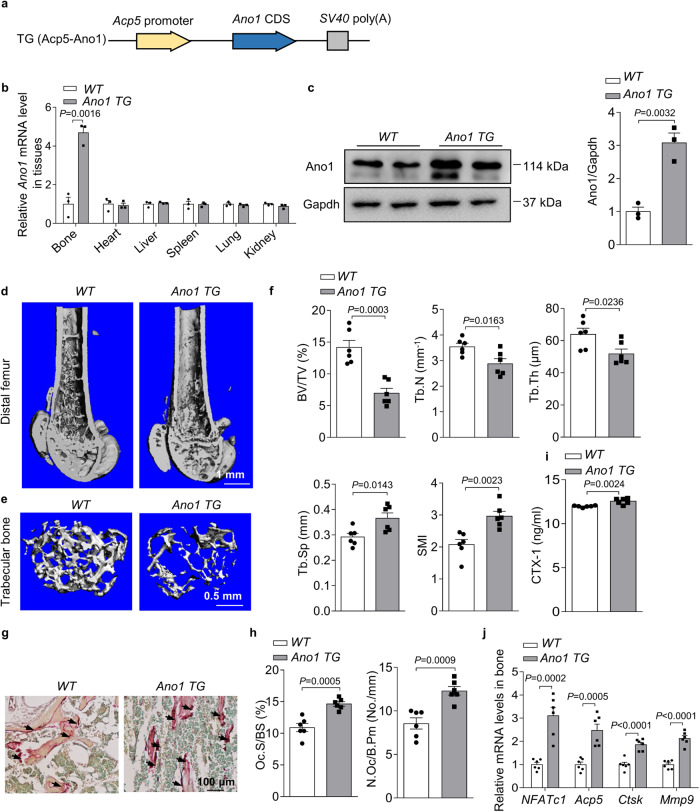
Fig. 3. Ano1 overexpression decreases bone mass.
a Schematic representation of the transgenic construct used to generate Ano1 transgenic mouse lines. b QRT-PCR analysis of Ano1 mRNA level in bone and other tissues from 6-month-old WT and osteoclast-specific Ano1 over expression (Ano1 TG) mice (n = 3). Ano1 mRNA level in all tissues was normalized to WT mice. c Western blot analysis of Ano1 protein level in bone tissues from WT and Ano1 TG mice mice (left). The quantification of Ano1 protein level in bone from two groups (right) (n = 3). d Representative images showing three-dimensional distal femurs by micro-CT reconstruction from WT and Ano1 TG female mice at 6 months old. Scale bar, 1 mm. e Representative images showing three-dimensional trabecular architecture by micro-CT reconstruction at the distal femurs from WT and Ano1 TG mice at 6 months old. Representative images of six independent tissue in each group. Scale bar, 0.5 mm. f Micro-CT measurements for BV/TV, Tb.N, Tb.Th, Tb.Sp, and SMI at the distal femurs from WT and Ano1 TG mice (n = 6). g Representative images of TRAP staining of the proximal tibia from WT and Ano1 TG mice. Scale bar, 100 μm. h Histomorphometric analysis of the images for number of osteoclasts per bone perimeter (N.Oc/B.Pm) and osteoclast surface per bone surface (Oc.S/BS) (n = 6). i ELISA analysis of CTX-1 protein levels in the serum from WT and Ano1 TG mice (n = 6). j QRT-PCR analysis of NFATc1, Acp5, Ctsk, and Mmp9 mRNA levels in bone tissues from WT and Ano1 TG mice (n = 6). All data are the mean ± s.e.m. Statistical analysis for comparison of two groups was performed using two-tailed unpaired Student’s t-test. Source data are provided as a Source Data file.

