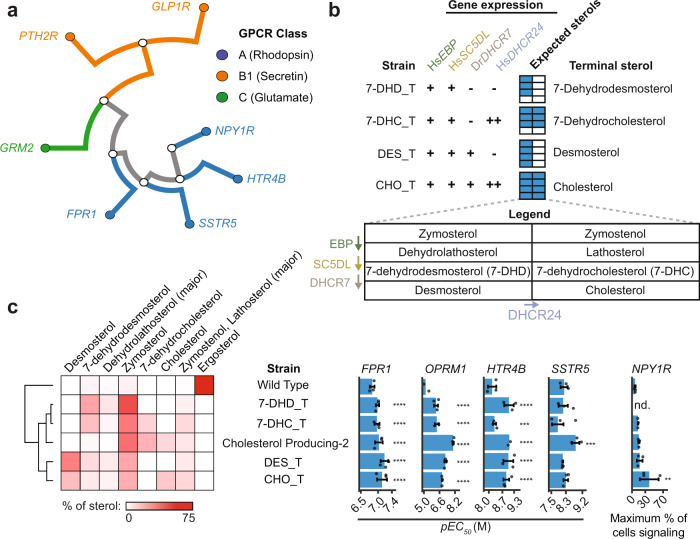
Fig. 7. Effect of cholesterol on the activity of different human GPCRs.
a Phylogenetic relationships of the GPCRs tested. b Strains, designated by their terminal sterol, were built to produce all sterols up to the indicated terminal sterols by introducing sterol biosynthetic genes under native ergosterol promoters (+) or strong yeast promoters (++) in a erg2/3/5/6 biosensor background. (−) indicates no gene is present. The expected sterol space is diagrammed in the expected sterols legend. c Sterol profiles of strains with the indicated sterol backgrounds were determined. Biosensors based on expressing HTR4B, FPR1, OPRM1, SSTR5, and NPY1R in all sterol backgrounds were assayed in the presence of their agonists by flow cytometry to construct dose-response curves used to determine pEC50s and the maximum percent of cells signaling. Where responses were too weak to determine pEC50, maximum percent of cells signaling is reported. Data presented as mean +/− SD. Unpaired one-way ANOVA: n = 3 biologically independent experiments except n = 2 for HTR4B in Cholesterol Producing-2 and OPRM1 in Wild Type; >10,000 cells/strain/replicate; P < 2.2e−16 for HTR4B, FPR1, OPRM1, SSTR5 assays, P = 0.02518 for NPY1R assay. Dunnett’s tests against WT shown. *, P < 0.05; **, P < 0.01; ***, P < 0.001; ****, P < 0.0001. OPRM1, Wild Type, and OPRM1, Cholesterol Producing-2 data are replotted from Fig. 6c. Source data are provided as a Source Data file.

