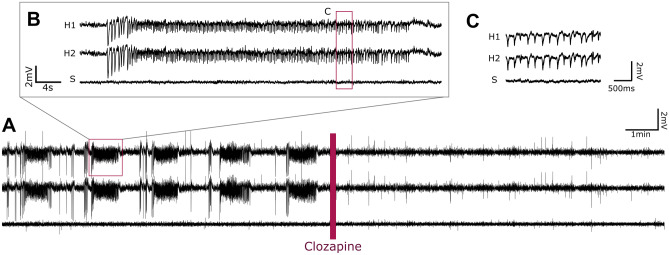
Fig. 1.
Representative example of an EEG trace. A Animals display frequent seizures during baseline (10 min are displayed), and those are suppressed after chemogenetic treatment (10-min EEG recorded during the first hour after treatment is shown). B Zoom on an epileptic seizure recorded during baseline (70 s). C Additional zoom (5 s) on the EEG during a seizure. The red bar indicates injection of 0.1 mg/kg clozapine; H1 and H2 are the 2 hippocampal recording channels, and S indicates the scalp EEG

