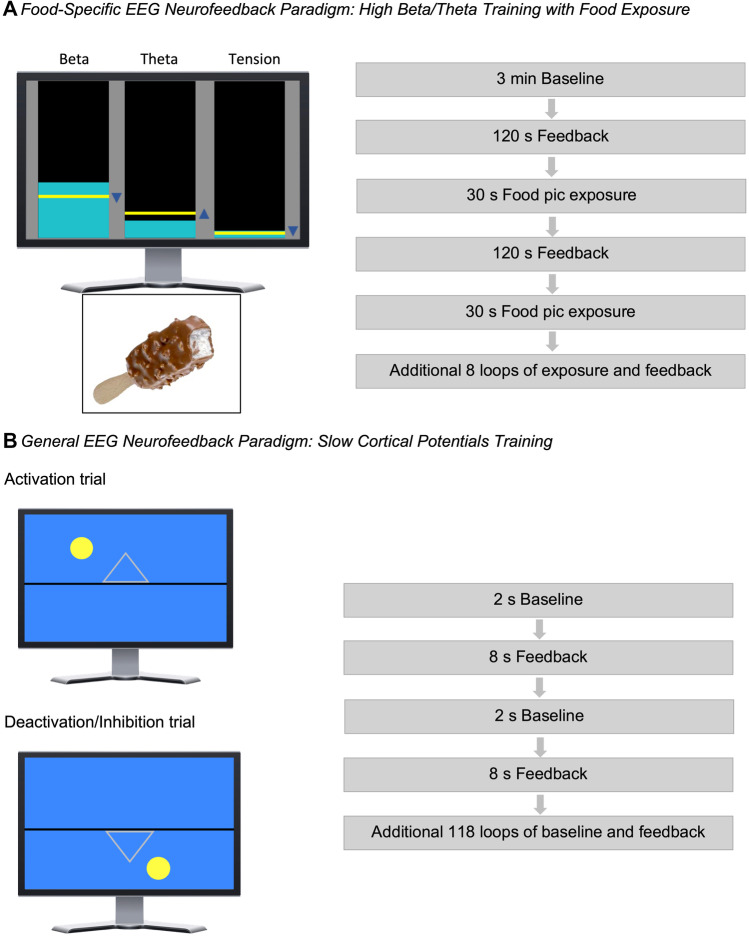
Fig. 1.
EEG neurofeedback paradigms. A Beta, 23–28 Hz, theta, 5–7 Hz. Tension represents muscular activity 60–80 Hz. Arrows beside bars indicate intended direction of training. Yellow lines represent the threshold of successful reduction/enhancement. Turquoise bars are constantly updated and show real time activity of each frequency band. Exemplary food picture provided by food pic database [37]. B Activation trial trains cortical activation associated with electrical negativation of slow cortical electrical deflections, illustrated by a yellow ball moving upward. Inhibition trial trains cortical inhibition associated with electrical positivation of slow cortical electrical deflections, illustrated by the yellow ball moving downward

