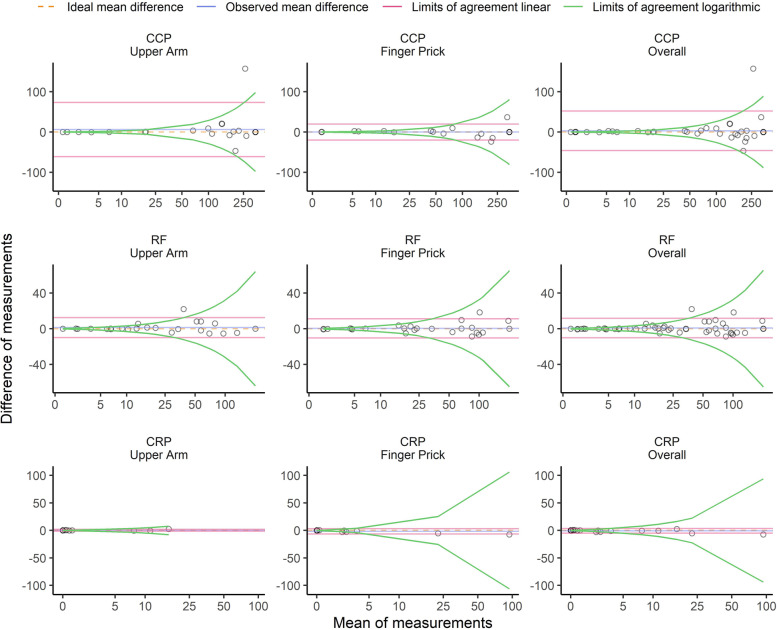
Fig. 4.
Bland-Altman comparison of the capillary blood and venous blood results with respect to C-reactive protein and autoantibody results. Bland-Altman diagrams showing differences in the measurements of anti-cyclic citrullinated peptide antibodies (CCP; U/ml), rheumatoid factor immunoglobulin M (RF; IU/ml)), and C-reactive protein (CRP; mg/l) between venous blood sampling and capillary blood sampling (upper arm, left; finger pricking, middle; combined groups, right). The dotted lines represent the ideal mean difference, the blue lines represent the observed mean difference, and the red and green lines indicate the limits of agreement on the additive scale and multiplicative scale, respectively

