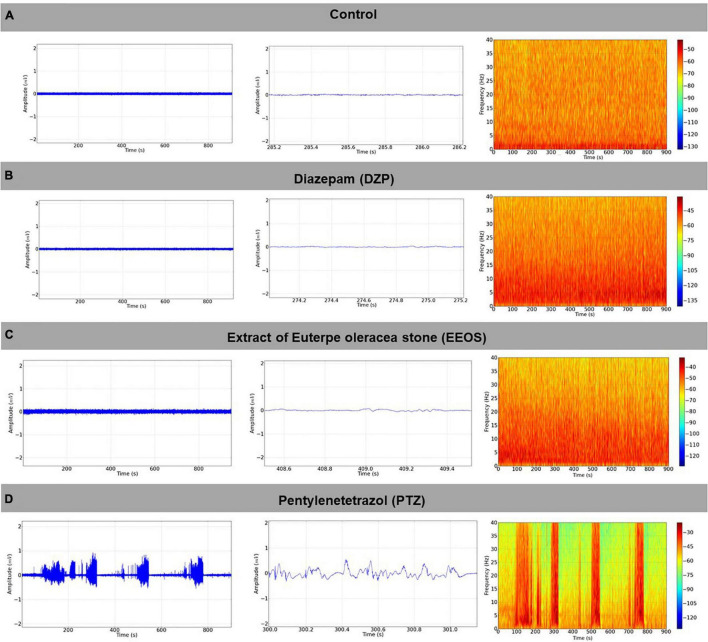
FIGURE 1.
Baseline electroencephalogram (EEG) tracing, the signal obtained from the right hemisphere, using as a reference the left hemisphere with 1 s magnification (in the center), and the respective energy distribution spectrogram (right) (A); electrocorticographic (ECoG) tracing after diazepam (DZP) administration (5 mg/kg i.p.) (left), with 1-s amplification (center) and power distribution spectrogram (right) (B); ECoG record observed after the administration of extract of Euterpe oleracea stones (EEOS) (300 mg/kg i.p.), with magnification and spectrogram (C), ECoG tracing after administration of pentylenetetrazol (PTZ) 60 mg/kg i.p., with amplification containing 1 s of the recording in the tracing, and a spectral energy distribution graph (spectrogram) (D) (900 s record length).

