FIGURE 3.
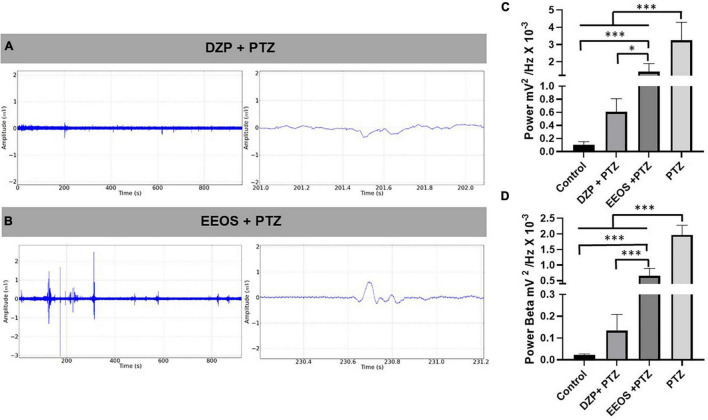
Electrocorticographic (ECoG) tracing of diazepam (DZP) (A) and extract of Euterpe oleracea stones (EEOS) (B), seizure inhibition after pentylenetetrazol (PTZ) administration. (C) Total power averages of the control records, DZP + PTZ, EEOS + PTZ, and PTZ for PTZ-induced seizure outbreaks. (D) Demonstration of the potency of beta waves after administration of DZP + PTZ and EEOS + PTZ compared to the means obtained from the beta waves for PTZ. Different letters in columns show significant differences after ANOVA followed by Tukey’s test (*p < 0.01, ***p < 0.0001, n = 9).

