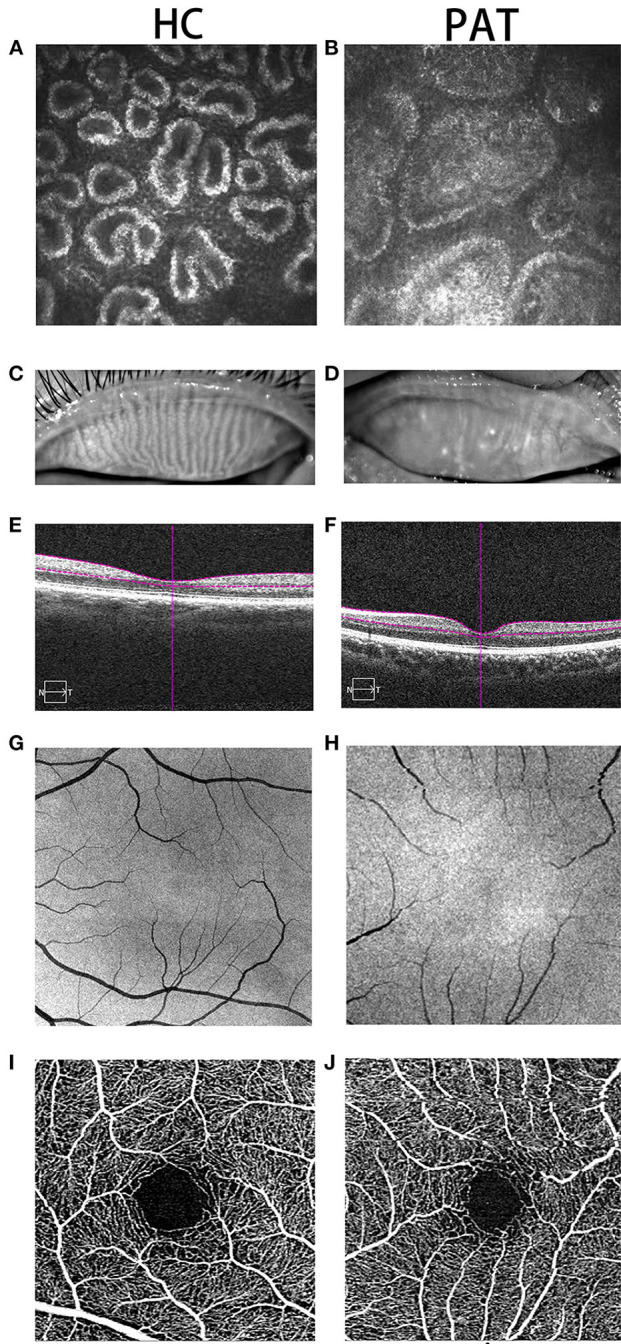
Figure 1.

Typical pictures of HC and PAT groups. Two groups of MGs were photographed by corneal confocal microscope. As can be seen from (A,B), compared with the HC group, the MG in the PAT group was significantly blocked, and gland blockage was widened at the same time. What's more, we photographed the changes of the MGs under the naked eye in the HC group and the PAT group. From (C,D), we can clearly observe that the MG in the HC group is clearer than that in the PAT group. Therefore, we can speculate that obesity may lead to tarsal gland blockage and degeneration. (E,F) According to the cross-sectional images of retinal thickness obtained, we can observe that the choroidal thickness in the PAT group is significantly thinner than that in the HC group. We also observed that the capillaries in the HC group (G,I) were more developed than those in the PAT group (H,J) according to the fundus vascular images we obtained, which showed that obesity may reduce the thickness of choroid and fundus blood supply, and may further cause fundus lesions. HC, healthy control; PAT, MGD patient in SO population; MG, meibomian gland.
