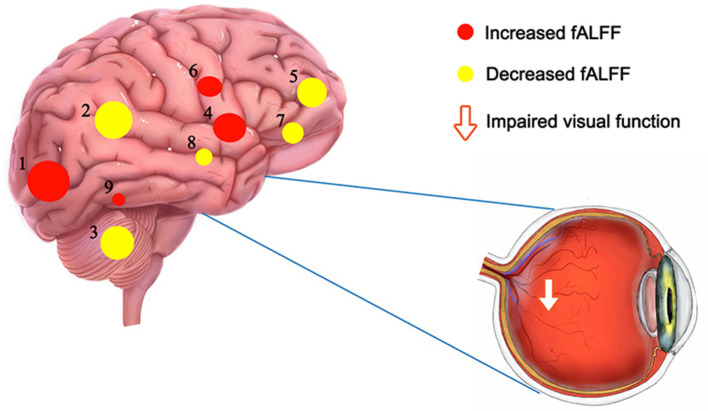
Figure 4.
The fALFF results of brain activity in the PAT group. Compared with the HCs, the fALFF of the following regions were increased to various extents: 1-left middle occipital gyrus (t = 4.9), 4-right globus pallidum (t = 4.36), 6-right anterior cingulate and paracingulate gyri (t = 4.24), 9-left lingual gyrus (t = 3.54), and decreased fALFF values in the 2-left inferior parietal gyrus (t = – 4.75), 3-right cerebellum (t = – 4.69), 5-right medial orbitofrontal gyrus (t = – 4.35), 7- left triangle inferior frontal gyrus (t = – 4.05) and 8-left fusiform gyrus (t = – 3.688). The sizes of the spots denote the degree of quantitative changes. HCs, healthy controls; fALFF, fractional amplitude of low-frequency fluctuations; PAT, MGD patient in SO population.

