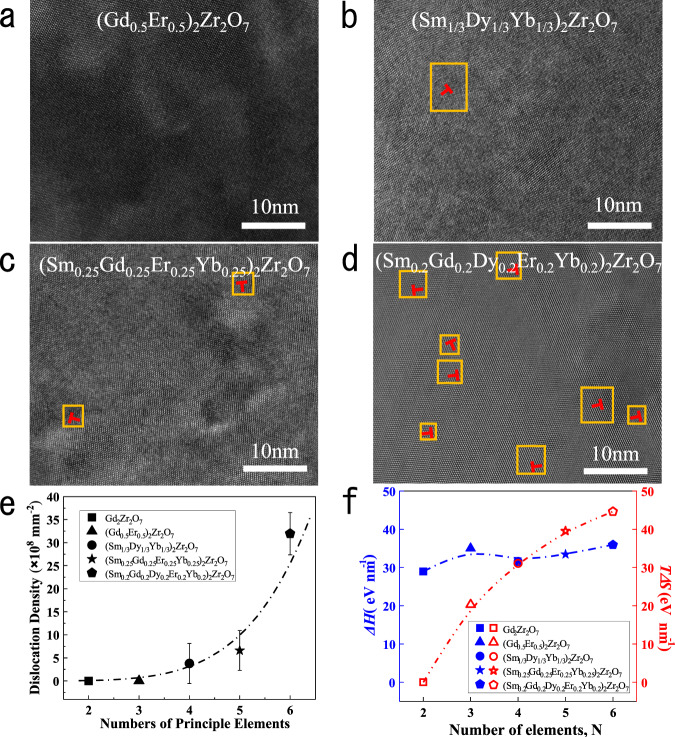
Fig. 3. High-resolution characterization and dislocation density of samples with different principle elements.
a (Gd0.5Er0.5)2Zr2O7; b (Sm1/3Dy1/3Yb1/3)2Zr2O7; c (Sm0.25Gd0.25Er0.25Yb0.25)2Zr2O7; d (Sm0.2Gd0.2Dy0.2Er0.2Yb0.2)2Zr2O7; e Dislocation density varies with numbers of principle elements (The error bars represent the standard deviation of calculated dislocation density.); f Enthalpy change (blue line and symbols) of an edge dislocation compared with the entropy gain “TΔS” (red line and symbols) with increasing number of the principle elements. The yellow squares mark the area around the dislocations.

