
FIGURE 2.
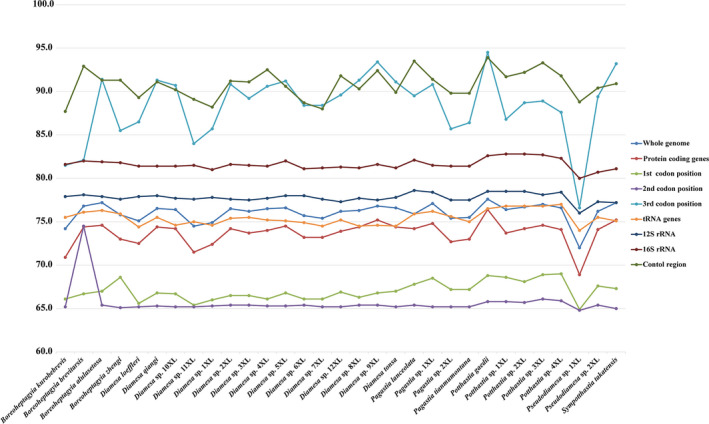
A+T content of mitochondrial genes of Diamesinae species. The X‐axis shows the species names and the Y‐axis shows the percentage of A+T content
Official websites use .gov
A
.gov website belongs to an official
government organization in the United States.
Secure .gov websites use HTTPS
A lock (
) or https:// means you've safely
connected to the .gov website. Share sensitive
information only on official, secure websites.
A+T content of mitochondrial genes of Diamesinae species. The X‐axis shows the species names and the Y‐axis shows the percentage of A+T content