FIGURE 4.

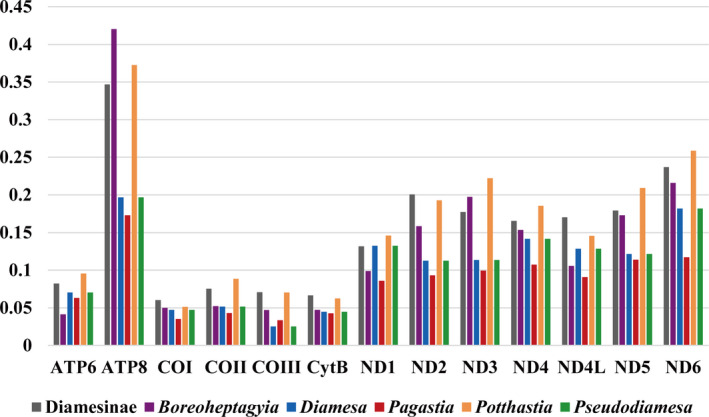
Evolution rate of each PCG of Diamesinae species. The X‐axis shows the names of PCGs and the Y‐axis shows the Ka/Ks value

Evolution rate of each PCG of Diamesinae species. The X‐axis shows the names of PCGs and the Y‐axis shows the Ka/Ks value