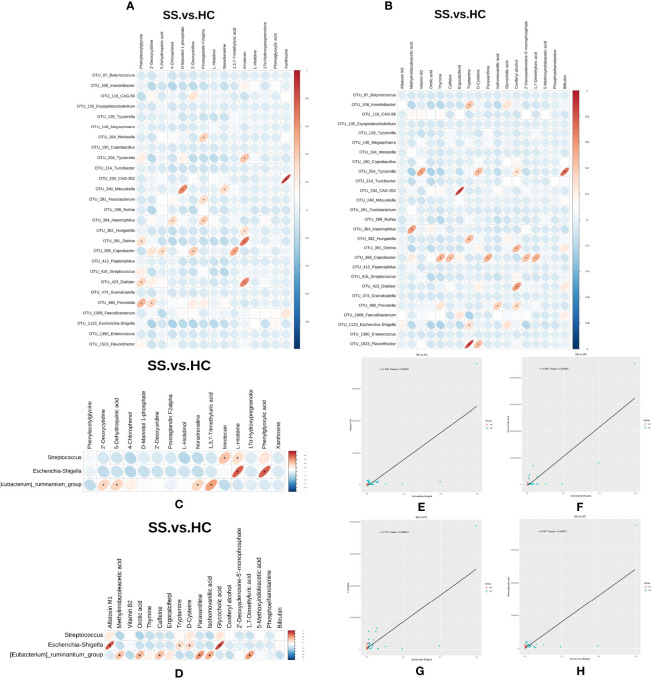
Figure 6.
Cross-correlation analysis between microbiota and metabolites. (A, B) Heatmap of the correlation between the top 28 OTUs with statistical difference annotated at the genus level and metabolites in the ESI- and ESI+ ion modes. (C, D) Heatmap of the correlation between the three microbiotas in genus level and metabolites in the ESI- and ESI+ ion modes. The horizontal coordinate represents the differentially abundant bacteria at the level of the 16S gene, and the vertical coordinate represents the differentially abundant metabolites. Red indicates a positive correlation, blue indicates a negative correlation, and an asterisk (*) indicates statistical significance, that is, P < 0.05. (E–H) Scatter plot of the correlation between Escherichia-Shigella and four metabolites (aflatoxin M1, glycocholic acid, L-histidine and phenylglyoxylic acid).

