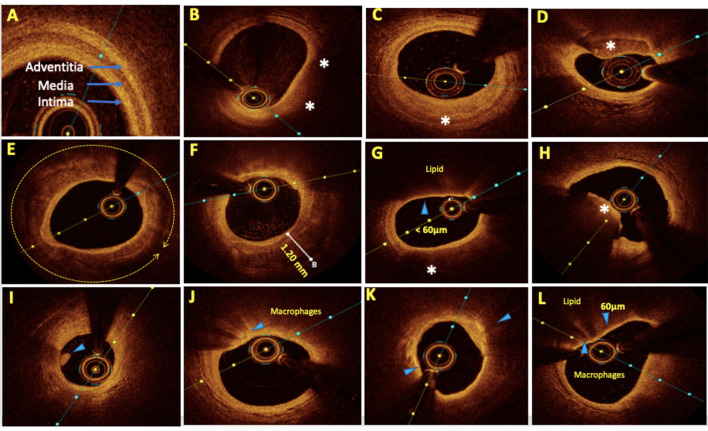
Figure 1.
Representative optical coherence tomography (OCT) images with various plaque morphologies. (A) Normal coronary, (B) lipid-rich plaque (LRP), (C) fibrotic plaque, (D) calcific nodule, (E) near 360° arc of calcific plaque, (F) deep calcium deposition, (G) thin cap fibroatheroma (TCFA), (H) intraluminal red thrombus, (I) intraluminal white thrombus, (J) bright spots or bands at the boundary between the fibrous cap and lipid core suggestive of macrophages, (K) bright signal-rich cholesterol crystals, and (L) vulnerable plaque formed by a large lipid pool covered by TCFA with macrophage infiltration. Areas of interest were highlighted by arrows and asterisks.

