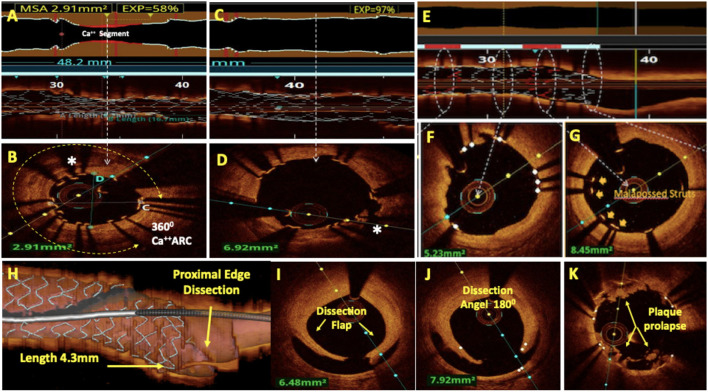
Figure 3.
Post-PCI assessment by OCT. (A) Lumenogram and L mode showed under-expanded stent (UES) with minimum stent area (MSA) of 2.91 mm2 and 58% stent expansion. (B) Cross-sectional image at MSA revealed 360° arc of calcium as a cause of UES. (C) Lumenogram and L mode showed 97% stent expansion after the treatment of UES with ultra-high-pressure balloon dilatation. (D) A cross-sectional image shows the fracture of the calcium arc resulting in the resolution of the UES. (E) A rendered stent view shows well-apposed stent struts (white) and malapposed stent struts (red) corresponding to the white and red bars in the apposition indicator. Apposition (F) and mal-apposition (G) of the stent struts can also be well-appreciated on respective cross-sectional images. (H–J): Major proximal stent edge dissection is seen with the dissection flap extending to media, dissection angle of 180° and 4.3 mm dissection length on three-dimensional (3D) reconstruction. OCT with its better axial resolution enables clearer and more frequent visualization of in-stent tissue prolapse (K).

