Figure 3.
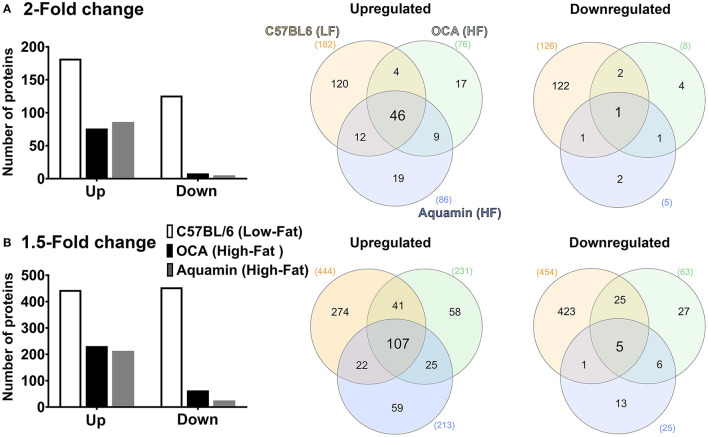
Proteomic analysis. Lysates were prepared from liver tissue of individual mice (five per group) and subjected to Tandem Mass Tag (TMT) labeling / mass spectroscopy as described in the Materials and Methods Section. Data from individual animals were merged by treatment group for analysis. Left panels: Abundance ratios of all proteins were calculated by comparing the normalized abundance of each group to the high-fat control group. The upper panel indicates the number of proteins that were increased or decreased by 2-fold (A) or greater (with ≤ 2% FDR) and the lower panel indicates the number of proteins that were increased or decreased by 1.5-fold (B) or greater (with ≤ 2% FDR). Right panels: Venn diagrams showing the overlap in the number of proteins altered (increased or decreased) by an average of 2-fold (A) or greater (upper panel) or 1.5-fold (B) or greater (lower panel) among the three treatment groups relative to the high-fat control and unique to each group.

