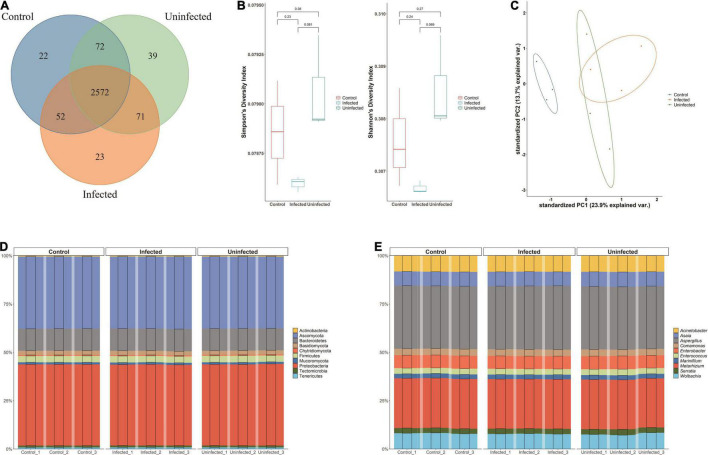
FIGURE 1.
Microbiota of Aedes albopictus. (A) Venn diagram of the overlapped species among DENV2-infected, DENV2-uninfected, and control group. (B) Within-sample diversity (alpha-diversity) with Shannon and Simpson index among three groups. The horizontal bars within boxes represent medians. The tops and bottoms of boxes represent the 75th and 25th percentiles, respectively. The upper and lower whiskers extend to data no more than 1.5× the interquartile range from the upper edge and lower edge of the box, respectively. (C) Unconstrained principle component analysis (for principal coordinates PC1 and PC2) with Bray–Curtis distance. (D) The microbiota composition of the three groups at the phylum level. (E) The microbiota composition of the three groups at the genera level.

