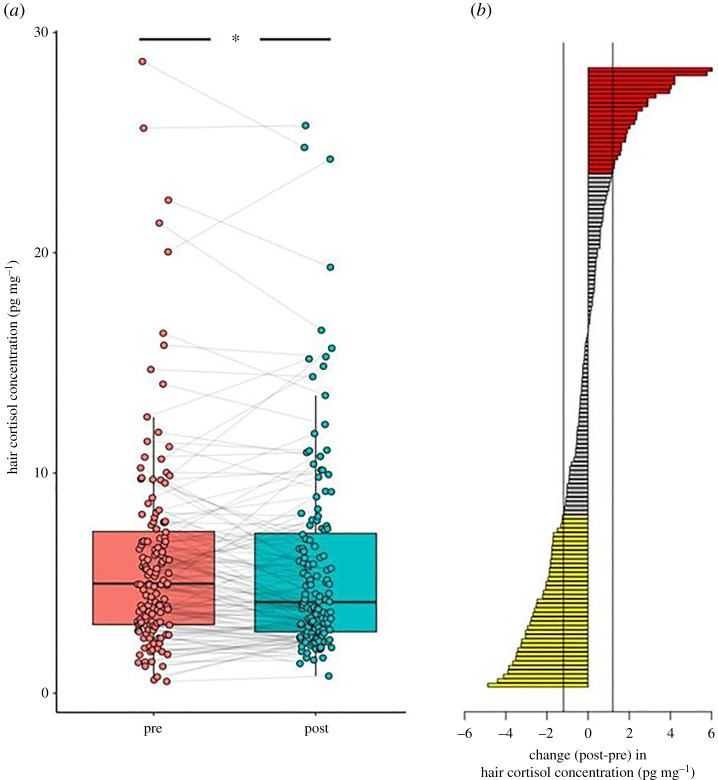
Figure 2.
A boxplot showing hair cortisol concentration (HCC) for each subject before lockdown (pre) and after the lockdown restrictions were implemented (post). (a) The change in HCC after the lockdown restrictions were implemented (post) compared to before (pre) per subject (b). Yellow bars indicate a decrease (28% of participants), and red bars (17%) an increase, of at least 1.2 pg mg–1 [23]. Most participants (55%) showed no change of at least 1.2 pg mg–1 as shown by the grey bars. (Online version in colour.)

