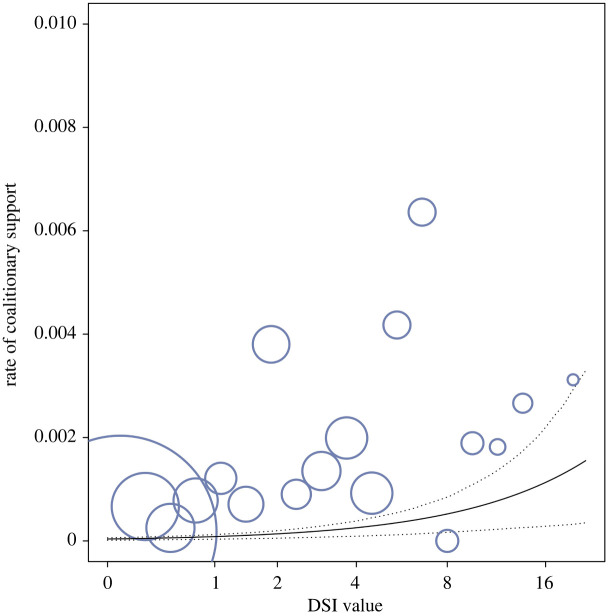
Figure 1.
Relationship between male–male dyadic bond strength (DSI value) and dyadic rate of coalitionary support. Dyads with stronger bonds were more likely to support each other in coalitions (GLMM: n = 958, p < 0.001). DSI values are represented in log-scale and binned in 19 bins. The area of the circles depicts the frequency with which a given number of coalitions per contact hour occurred in a given bin (mean = 3.29, range = 1 to 232). The solid line depicts the fitted model and the dashed lines depict the bootstrapped 95% confidence intervals with all other predictors being at their average (party and year manually dummy coded and centred). (Online version in colour.)

