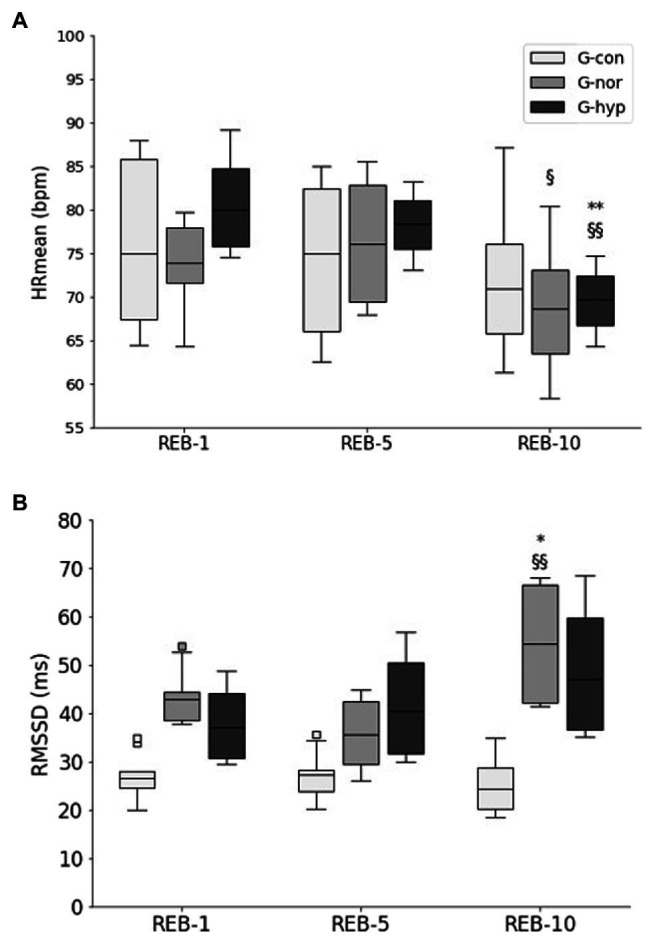
Figure 4.

Changes in HRmean (A), RMSSD (B) throughout the Rebalance© Program. G-con, control group; G-nor, normotensive group; G-hyp, hypotensive group. REB-1, −5, −10, Rebalance© session number 1, 5, and 10, respectively. HRmean, average heart rate during HRV measurement; HRV, heart rate variability; RMSSD, root-mean square difference of successive normal heart beats. Box plots represent median interquartile range (IQR, Q25–Q75), and error bars are maximal and minimal observations within 1.5 × IQR. Squares represent maximum and minimum observations above or below 1.5 × IQR. * and **Significantly different from REB-1 (p < 0.05 and p < 0.01, respectively); § and §§Significantly different from REB-5 (p < 0.05 and p < 0.01, respectively).
