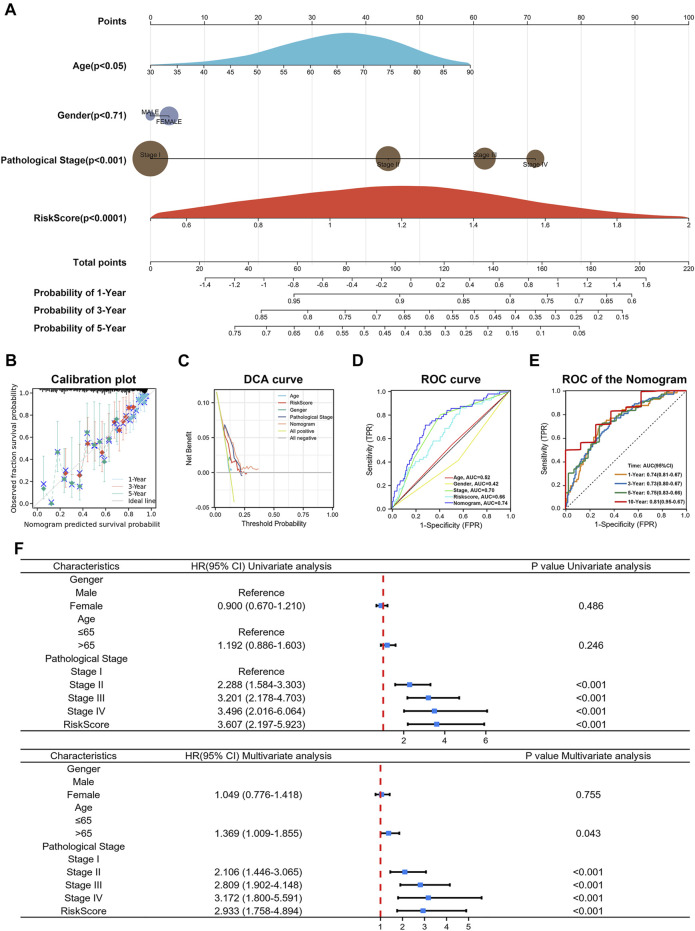
FIGURE 10.
Construction of nomogram. (A) Nomogram showed risk score’s efficacy in predicting 1-, 3-, and 5-year OS after combining patients age, gender, and pathological stage. (B–E) Calibration plot, DCA curve and ROC curve showed acceptable accuracy. (F) Univariate Cox analysis and multivariate Cox analysis of risk score.

