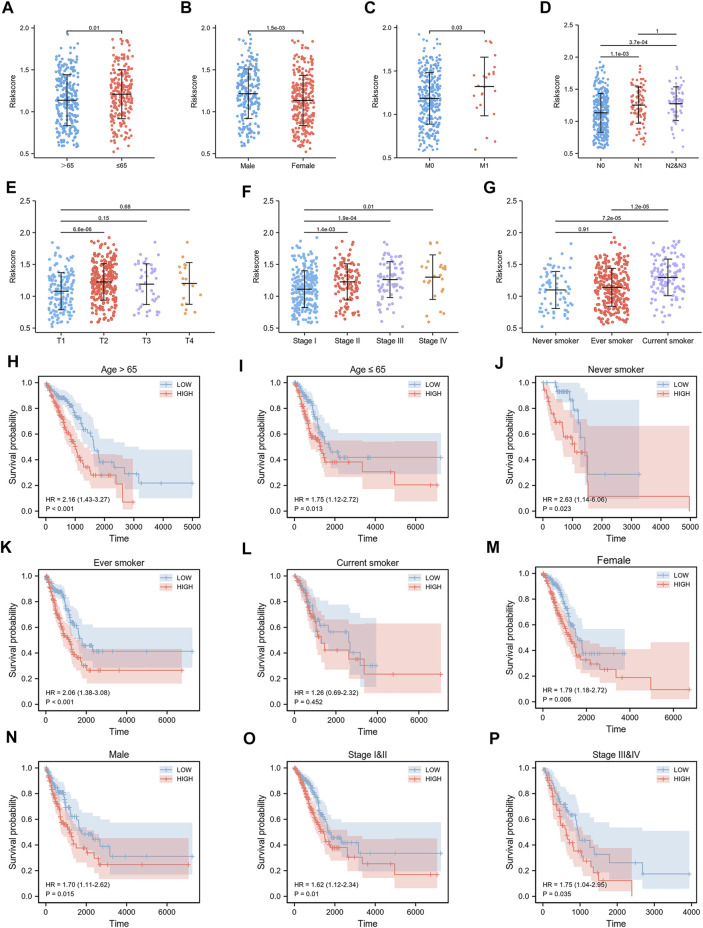
FIGURE 6.
Relationship between risk score and clinicopathological features. Risk score differed by age (A), gender (B), smoking status (G), TNM stage (C–E), and pathological stage (F). Survival curves of LUAD patients by age (H,I), smoking status (J–L), gender (M,N) and pathological stage (O,P) were obtained by comparing high-risk group with low-risk group.

