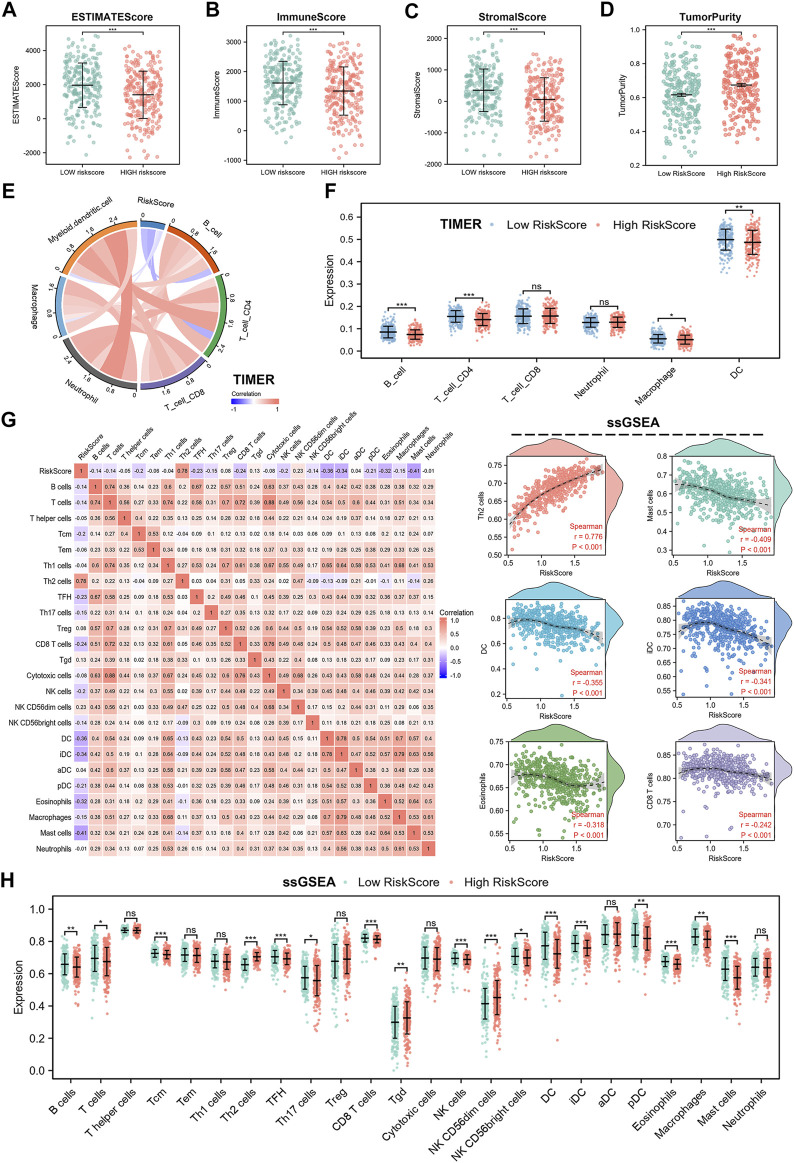
FIGURE 8.
Immune landscape in cell cycle checkpoints related signature. (A–D) ESTIMATE score, ImmuneScore, StromalScore and TumorPurity calculated by ESTIMATE algorithm. (E,F) Immune infiltration of 6 immune cell types using TIMER algorithm. (G) Relationship between risk score and abundance of 24 immune cell types. (H) Differences in abundance of 24 immune cells between high- and low-risk group.

