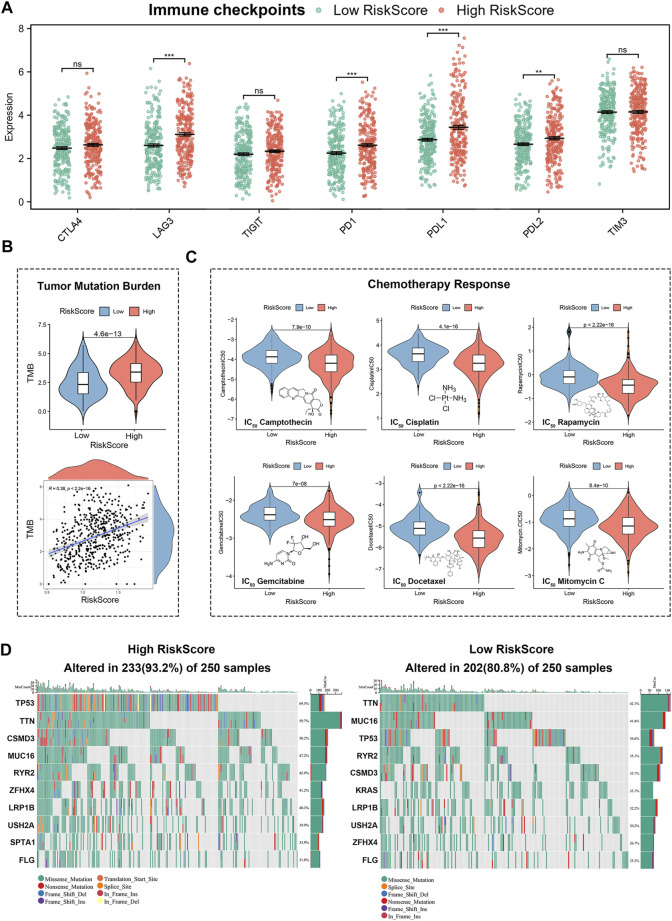
FIGURE 9.
Gene mutation and response prediction for immunotherapies and chemotherapies in 4-genes risk signature. (A) Differences in expression of immune checkpoints between high-risk group and low-risk group. (B) Relationship between risk score and tumor mutation burden (TMB). (C) Differences in chemotherapies between high and low risk groups. (D) Status of mutations between high- and low-risk groups.

