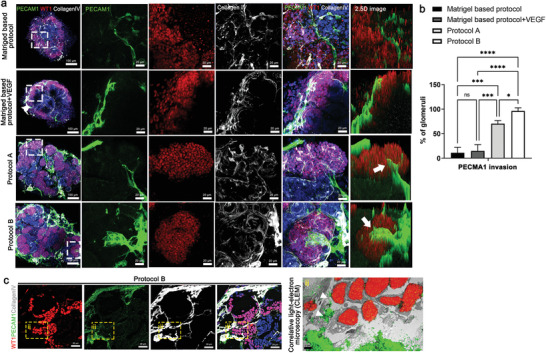
Figure 3.

Enhanced vascularization of kidney organoids cultured on kidney dECM by protocol B. a) Representative images of immunofluorescent staining of WT1 (podocyte), PECAM1 (vascular network), and CollagenIV (basement membrane) in kidney organoids. Invasion of PECAM1+ endothelial cells into WT1+ podocytes clusters (white arrow). Scale bar = 100 µm, 20 µm. b) Quantification of the percentage of PECAM1 invasion into the glomerular‐like structure in the kidney organoid (n = 3). c) Representative images of a correlative light‐ and electron‐microscope (CLEM) study by overlaying a confocal microscopy image stained to reveal PECAM1, WT1, and collagen IV with an electron microscope (EM) image of the same structures in the kidney organoids (panel ii). Scale bar = 20 µm for immunofluorescent staining and scale bar = 2 µm for EM. Values are mean ± SEM. NS, no significance, *p < 0.05, ***p < 0.001, ****p < 0.0001, measured by one‐way ANOVA with Tukey's multiple comparisons test.
