
Figure 6.
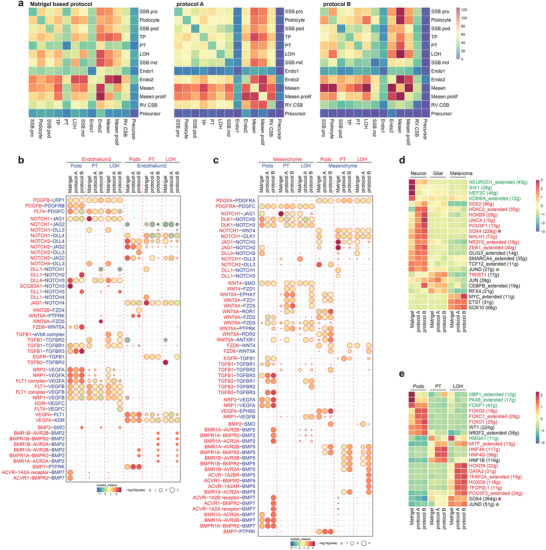
Cell communication network in kidney organoid. a) Heatmap showing the potential ligand‐receptor pairs between cell types predicted by CellphoneDB. Bubble plot showing the selected ligand‐receptor interactions with b) Endothelium2 or c) Mesenchyme cells; scaled means indicated by color and p‐value by circle size. Heatmap showing the scaled regulon activity from SCENIC in d) off‐target cell types and e) nephron cell types. The states of the transcription factors were indicated in red (activated in protocol A and B) and green (inactivated in protocol A and B). Abbreviations: SCENIC, single‐cell regulatory network inference and clustering.