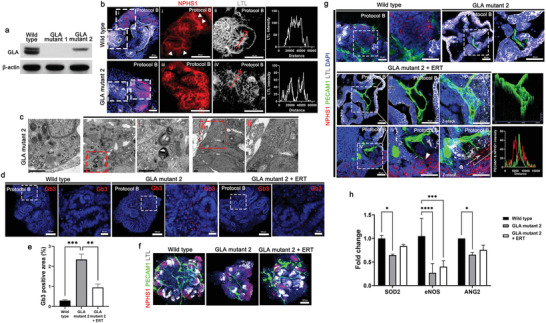
Figure 7.

Recapitulation of Fabry nephropathy with vasculopathy using GLA‐mutant human kidney organoids differentiated by protocol B. a) Representative western blot for expression of GLA (clones GLA mutant 1 and GLA mutant 2) in kidney organoids. b) Representative image of immunofluorescent staining of NPHS1 and LTL in wild type and GLA‐mutant kidney organoid. LTL across the line scan indicated by red arrows. Scale bar = 50 µm. c) Representative TEM images showing the accumulation of lipid droplet, glycoprotein and zebra bodies. Scale bar = 1 µm. d) Representative images of immunofluorescent staining of Gb3 in wild type and GLA mutant kidney organoids treated human recombinant agalsidase‐α as an enzyme replacement therapy (ERT). Scale bar = 100 µm and 20 µm. e) Quantification of percentage of Gb3 positive area (n = 3). f,g) Representative images of immunofluorescent staining of NPHS1, PECAM1, and LTL in wild type and GLA‐mutant kidney organoids treated with ERT. 2.5D image and line scan (white arrow) obtained from Z‐stack confocal image. White arrowheads indicate the invasion of the PECAM1+ endothelial cells into NPHS1+ podocyte structure. Scale bar = 100 µm for (f) and Scale bar = 50 µm for (g). h) qRT‐PCR analysis of SOD2, eNOS, and ANG2 (n = 3). Values are mean ± SEM. *p < 0.05, **p < 0.01, ***p < 0.001, ****p < 0.0001, measured by one‐way ANOVA and two‐way ANOVA with Tukey's multiple comparisons test.
