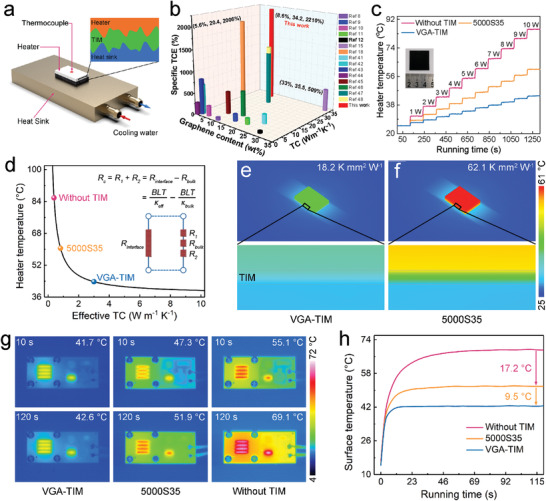
Figure 5.

The performance of VGA‐TIM. a) Schematic illustrating the experimental configuration used for TIM performance evaluation. b) Histogram of thermal conductivity and specific TCE versus the graphene content. c) Surface temperature evolution of the heater as a function of applied powers, and the inset is the photograph of VGA‐TIM. d) Steady‐state temperature of heater versus effective thermal conductivity (TC) of different TIMs. e,f) Simulation temperature profiles showing the excellent cooling efficiency of VGA‐TIM. g,h) Operating temperature evolution of LED chips indicated by an IR camera.
