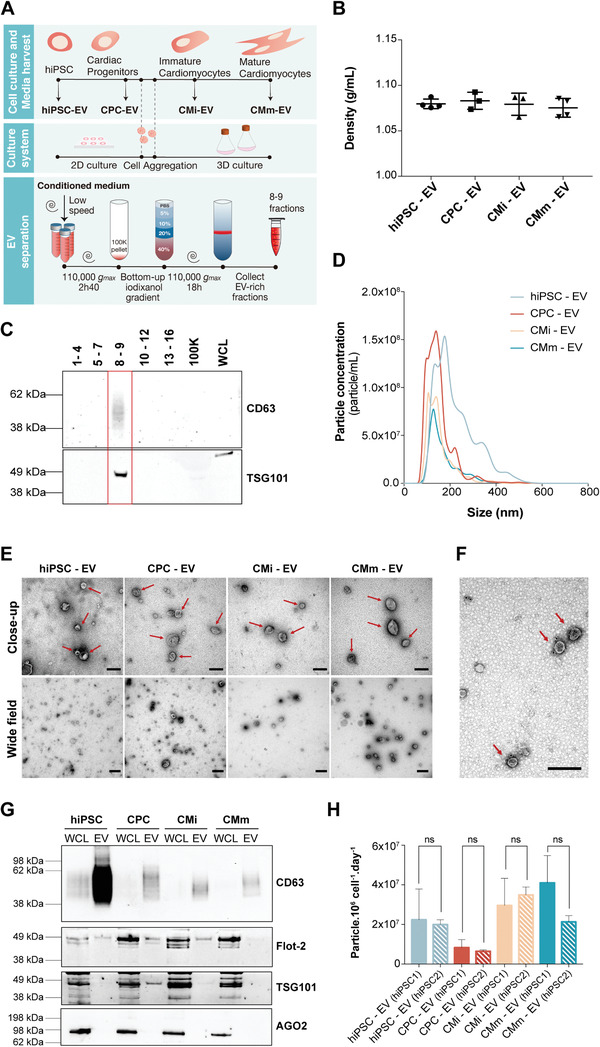
Figure 1.

Schematic representation of the experimental design and EV separation method validation. A) Overview of the cardiomyocyte differentiation and EV isolation processes from the different cell populations—human induced pluripotent stem cells (hiPSC) and their derivatives including cardiac progenitor cells (CPC) and cardiomyocytes at different stages of maturation (immature (CMi) and more mature (CMm) cells). B) Density of EV isolated in 8–9 gradient fractions. C) Validation of the EV separation method by western blot analysis of CD63 and TSG101 on density gradient fractions after ultracentrifugation. 100K—pellet resulting from the first ultracentrifugation. WCL: whole cell lysate. D) Typical size distribution profile of EV samples analyzed by nanoparticle tracking analysis (NTA). Plotted lines correspond to the averaged size distribution profiles from three EV isolations. E) Representative negative staining close‐up and wide‐field transmission electron microscopy (TEM) images of all EV samples. EVs are marked by red arrows. Scale bars: close‐up: 200 nm; wide‐field: 500 nm. F) Representative CD63 immunogold labeling of hiPSC‐EV. CD63‐labeled EVs are marked by red arrows. Scale bar: 200 nm. G) Western blot analysis of common EV markers (CD63, Flotilin‐2, and TSG101) and co‐isolated contaminants (AGO2) for 8–9 pooled gradient fractions. WCL: whole cell lysate. H) EVs yield obtained along hiPSC‐CM differentiation and maturation for both cell lines studied. No significant differences were found between cell lines, for each differentiation stage. In (B) and (H) results are plotted as mean ± SD (n = 3). n.s. (p > 0.05) by one‐way ANOVA with Sidak's multiple comparisons test, with a single pooled variance.
